
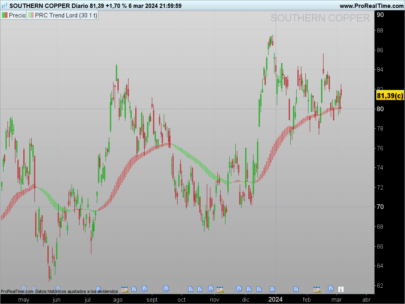
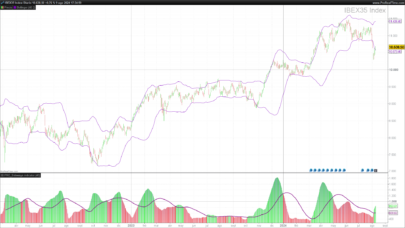
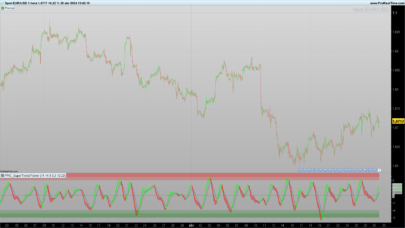
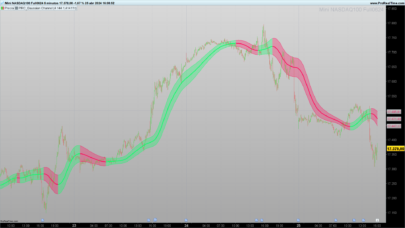
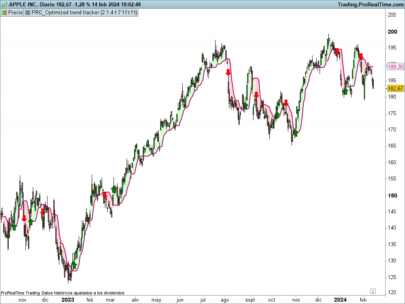
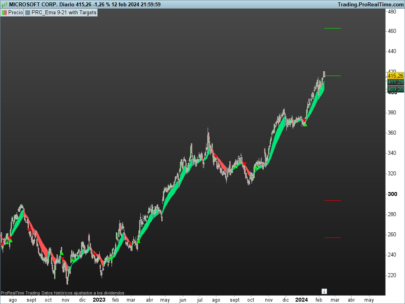
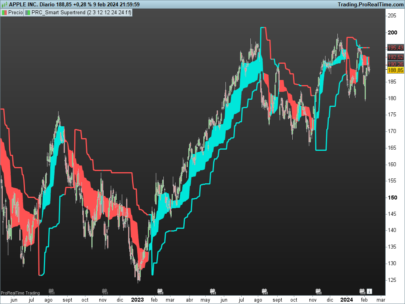
This code represents a trading strategy which smooths the price data with exponential averages and Heikin Ashi methodology, and then provides a visual representation of bullish or bearish bias with the oscillator and colored candles.
Here is a breakdown of the code:
Variables HAlen and HAlen2 are set to 100. These variables represent the lookback periods for calculating the exponential averages for the original and smoothed Heikin Ashi candles respectively.
The Exponential Moving Averages (EMA) of the open, close, high, and low prices are calculated over the HAlen period. This is done with the ExponentialAverage[HAlen](Open/Close/High/Low) calls.
The HA close (HAClose) is calculated as an average of the open, high, low, and close prices. The HA open (HAOpen) is calculated as an average of the open and close prices from the previous period and the close price of the current period.
The HA high (HAHigh) and low (HALow) are determined by taking the maximum and minimum of the high, low, open, and close prices respectively.
An additional smoothing is then applied to the HA candle’s open, close, high, and low using ExponentialAverage[HAlen2](HAOpen/HAClose/HAHigh/HALow). The results are stored in O2, C2, H2, and L2 respectively.
HAAvg represents the average of the smoothed high and low of the Heikin Ashi candle.
OSCLen is set to 7, which represents the period for the oscillator.
The oscillator bias (OSCBias) is computed as the percentage difference between the smoothed close and open, and then smoothed again using an EMA over the OSCLen period to get OSCSmooth.
Depending on the value of OscBias relative to OscSmooth, the RGB (red, green, blue) color values are assigned for the candle drawing. The RGB values are used later to color the drawn candle.
A candle is drawn using the smoothed Heikin Ashi open, high, low, and close, and it is colored according to the determined RGB values.
Finally, the smoothed high and low of the Heikin Ashi candle and the average are returned as “BIAS High”, “BIAS Low”, and “BIAS Average” respectively.
Code converted from discussion in topic: https://www.prorealcode.com/topic/market-bias-indicator/
|
1 2 3 4 5 6 7 8 9 10 11 12 13 14 15 16 17 18 19 20 21 22 23 24 25 26 27 28 29 30 31 32 33 34 35 36 37 38 39 40 41 42 43 44 45 46 47 48 |
HAlen=100 //HA period HAlen2=100 //HA smoothing period //Calculations xO=ExponentialAverage[HAlen](Open) xC=ExponentialAverage[HAlen](Close) xH=ExponentialAverage[HAlen](High) xL=ExponentialAverage[HAlen](Low) HAClose=(xO+xH+xL+xC)/4 xHAOpen=(xO+xC)/2 HAOpen=(xHAOpen[1]+HAClose[1])/2 HAHigh=Max(xH,Max(HAOpen,HAClose)) HALow=Min(xL,Min(HAOpen,HAClose)) O2=ExponentialAverage[HAlen2](HAOpen) C2=ExponentialAverage[HAlen2](HAClose) H2=ExponentialAverage[HAlen2](HAHigh) L2=ExponentialAverage[HAlen2](HALow) HAAvg=(H2+L2)/2 OSCLen=7 //Oscillator period OSCBias=100*(C2-O2) OSCSmooth=ExponentialAverage[OSCLen](OSCBias) If OscBias>0 and OscBias>=OscSmooth then R=0 G=255 B=0 ElsIf OscBias>0 and OscBias<OscSmooth then R=0 G=150 B=0 ElsIf OscBias<0 and OscBias<=OscSmooth then R=255 G=0 B=0 ElsIf OscBias<0 and OscBias>OscSmooth then R=150 G=0 B=0 EndIf Drawcandle(O2,H2,L2,C2) Coloured(R,G,B) Return H2 as "BIAS High", L2 as "BIAS Low", HAAvg as "BIAS Average" |
Share this
No information on this site is investment advice or a solicitation to buy or sell any financial instrument. Past performance is not indicative of future results. Trading may expose you to risk of loss greater than your deposits and is only suitable for experienced investors who have sufficient financial means to bear such risk.
ProRealTime ITF files and other attachments :
Find other exclusive trading pro-tools on ![]()
PRC is also on YouTube, subscribe to our channel for exclusive content and tutorials


Bonjour Nicolas,
Je suis a la recherche d’indicateurs pour me donner la meilleure indication possible de la tendance que devrait suivre actif travaille dans la journee. Que me proposeriez-vous?
Merci par avance,
Brice