

Last Two Highest High and Lowest Low as Horizontal Lines – Yearly Quarterly, Monthly, Weekly, Daily, 4 Hour and 1 Hour
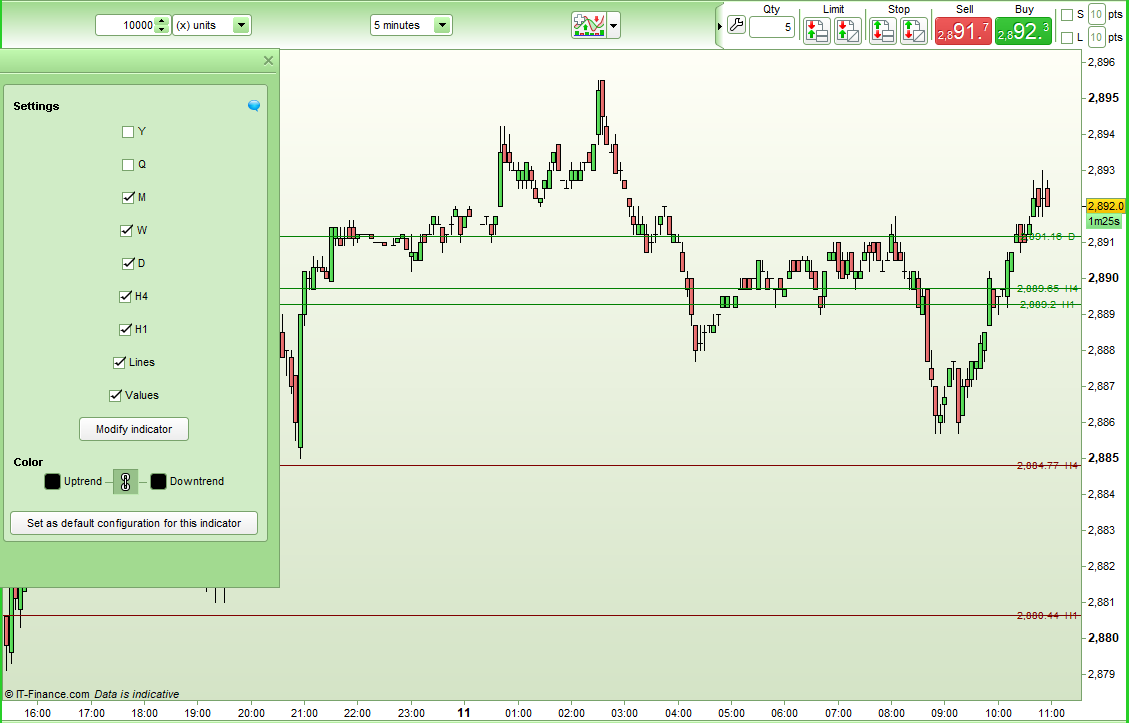
This indicator does the same calculations as my ‘Last Two Highest High and Lowest Low Horizontal Lines – Yearly Quarterly, Monthly, Weekly, Daily, 4 Hour and 1 Hour’ indicator but displays the results only on the last bar as a horizontal line where the latest projection is calculated to be.
At the start of a new period this indicator calculates lines connecting the previous two periods highest highs and previous two lowest lows. It then projects these lines forward throughout the latest period and draws horizontal lines on the chart at the latest projection values.
It can find the last two yearly, quarterly, monthly, weekly, daily, 4 hourly and 1 hourly highest highs and lowest lows and calculates how those lines would project forward At the start of a new year, quarter, month, week, day, 4 hour period, 1 hour period new lines and their projections forward are calculated.
Values for the latest projection are shown. These can be turned off with the ‘Values’ setting.
You can turn on or off the lines using the ‘Lines’ setting.
The indicator can be used on any time frame chart but if there is not enough data to provide two HH or two LL then it won’t draw any lines for that time period. You can only draw slower time frame lines on a faster time frame chart so for example you obviously cannot draw H1 lines a daily chart
For daily calculations Sunday candles are included in Fridays data so the projected lines on a Monday are from the Thursday daily HH and daily LL and the daily HH and daily LL of Friday and Sunday combined. Weeks start at the open of the Sunday candle.
Each line is labelled. If you add this indicator to the same chart as my ‘Last Two Highest High and Lowest Low Lines – Yearly Quarterly, Monthly, Weekly, Daily, 4 Hour and 1 Hour’ indicator and turn off the lines and values then it can provide up to date labels for that indicator.
Apply to the price chart
The lines can be used as support and resistance or for breakout trading – however you wish.
It will be slow to draw if you apply it to a lot of historical bars.
I suggest downloading and importing the indicator to get full functionality.
//Last Two HH LL Lines Horizontal
//Coded by Vonasi
//Date 20190411

defparam drawonlastbaronly = true

//Y = 0
//Q = 0
//M = 1
//W = 0
//D = 0
//H4 = 0
//H1 = 0
//Lines = 1
//Values = 1

c = 0
if lines then
c = 255
endif

//Yearly
if y then
once yhi1 = low
once yhi2 = low
once yhiindex1 = barindex
once yhiindex2 = barindex

once ylo1 = high
once ylo2 = high
once yloindex1 = barindex
once yloindex2 = barindex

if high >= yhi1 then
yhi1 = high
yhiindex1 = barindex
endif

if low <= ylo1 then
ylo1 = low
yloindex1 = barindex
endif

if openyear <> openyear[1] then
yhistart = yhi1
yhistartindex = yhiindex1

if yhi1 >= yhi2 then
yhiadj = (yhi1 - yhi2) / (yhiindex1 - yhiindex2)
yhiend = (yhistart + (yhiadj * (barindex - yhistartindex)))
yhidir = 1
endif

if yhi1 < yhi2 then
yhiadj = (yhi2 - yhi1) / (yhiindex1 - yhiindex2)
yhiend = (yhistart - (yhiadj * (barindex - yhistartindex)))
yhidir = -1
endif

ylostart = ylo1
ylostartindex = yloindex1

if ylo1 >= ylo2 then
yloadj = (ylo1 - ylo2) / (yloindex1 - yloindex2)
yloend = (ylostart + (yloadj * (barindex - ylostartindex)))
ylodir = 1
endif

if ylo1 < ylo2 then
yloadj = (ylo2 - ylo1) / (yloindex1 - yloindex2)
yloend = (ylostart - (yloadj * (barindex - ylostartindex)))
ylodir = -1
endif

yhi2 = yhi1
yhiindex2 = yhiindex1
yhi1 = low
yhiindex1 = barindex
ylo2 = ylo1
yloindex2 = yloindex1
ylo1 = high
yhiindex1 = barindex
endif

if yhidir = 1 then
drawhline(yhiend) coloured (0,128,0,c)
yhistartindex = barindex
yhistart = yhiend
yhiend = (yhistart + (yhiadj * ((barindex+1) - yhistartindex)))
endif

if yhidir = -1 then
drawhline(yhiend) coloured (0,128,0,c)
yhistartindex = barindex
yhistart = yhiend
yhiend = (yhistart - (yhiadj * ((barindex+1) - yhistartindex)))
endif

if ylodir = 1 then
drawhline(yloend) coloured (128,0,0,c)
ylostartindex = barindex
ylostart = yloend
yloend = (ylostart + (yloadj * ((barindex+1) - ylostartindex)))
endif

if ylodir = -1 then
drawhline(yloend) coloured (128,0,0,c)
ylostartindex = barindex
ylostart = yloend
yloend = (ylostart - (yloadj * ((barindex+1) - ylostartindex)))
endif

if values then
yhiendrnd = round(yhiend * 100) / 100
yloendrnd = round(yloend * 100) / 100
DRAWTEXT("#yhiendrnd# Y", barindex, yhiend[1], SansSerif, standard, 10) coloured (0,128,0)
DRAWTEXT("#yloendrnd# Y", barindex, yloend[1], SansSerif, standard, 10) coloured (128,0,0)
else
DRAWTEXT("Y", barindex, yhiend[1], SansSerif, standard, 10) coloured (0,128,0)
DRAWTEXT("Y", barindex, yloend[1], SansSerif, standard, 10) coloured (128,0,0)
endif
endif


//Quarterly
if q then
once qhi1 = low
once qhi2 = low
once qhiindex1 = barindex
once qhiindex2 = barindex

once qlo1 = high
once qlo2 = high
once qloindex1 = barindex
once qloindex2 = barindex

if high >= qhi1 then
qhi1 = high
qhiindex1 = barindex
endif

if low <= qlo1 then
qlo1 = low
qloindex1 = barindex
endif

if openmonth <> openmonth[1] and (openmonth = 1 or openmonth = 4 or openmonth = 7 or openmonth = 10) then
qhistart = qhi1
qhistartindex = qhiindex1

if qhi1 >= qhi2 then
qhiadj = (qhi1 - qhi2) / (qhiindex1 - qhiindex2)
qhiend = (qhistart + (qhiadj * (barindex - qhistartindex)))
qhidir = 1
endif

if qhi1 < qhi2 then
qhiadj = (qhi2 - qhi1) / (qhiindex1 - qhiindex2)
qhiend = (qhistart - (qhiadj * (barindex - qhistartindex)))
qhidir = -1
endif

qlostart = qlo1
qlostartindex = qloindex1

if qlo1 >= qlo2 then
qloadj = (qlo1 - qlo2) / (qloindex1 - qloindex2)
qloend = (qlostart + (qloadj * (barindex - qlostartindex)))
qlodir = 1
endif

if qlo1 < qlo2 then
qloadj = (qlo2 - qlo1) / (qloindex1 - qloindex2)
qloend = (qlostart - (qloadj * (barindex - qlostartindex)))
qlodir = -1
endif

qhi2 = qhi1
qhiindex2 = qhiindex1
qhi1 = low
qhiindex1 = barindex
qlo2 = qlo1
qloindex2 = qloindex1
qlo1 = high
qhiindex1 = barindex
endif

if qhidir = 1 then
drawhline(qhiend) coloured (0,128,0,c)
qhistartindex = barindex
qhistart = qhiend
qhiend = (qhistart + (qhiadj * ((barindex+1) - qhistartindex)))
endif

if qhidir = -1 then
drawhline(qhiend) coloured (0,128,0,c)
qhistartindex = barindex
qhistart = qhiend
qhiend = (qhistart - (qhiadj * ((barindex+1) - qhistartindex)))
endif

if qlodir = 1 then
drawhline(qloend) coloured (128,0,0,c)
qlostartindex = barindex
qlostart = qloend
qloend = (qlostart + (qloadj * ((barindex+1) - qlostartindex)))
endif

if qlodir = -1 then
drawhline(qloend) coloured (128,0,0,c)
qlostartindex = barindex
qlostart = qloend
qloend = (qlostart - (qloadj * ((barindex+1) - qlostartindex)))
endif

if values then
qhiendrnd = round(qhiend * 100) / 100
qloendrnd = round(qloend * 100) / 100
DRAWTEXT("#qhiendrnd# Q", barindex, qhiend[1], SansSerif, standard, 10) coloured (0,128,0)
DRAWTEXT("#qloendrnd# Q", barindex, qloend[1], SansSerif, standard, 10) coloured (128,0,0)
else
DRAWTEXT("Q", barindex, qhiend[1], SansSerif, standard, 10) coloured (0,128,0)
DRAWTEXT("Q", barindex, qloend[1], SansSerif, standard, 10) coloured (128,0,0)
endif
endif

//Monthly
if m then
once mhi1 = low
once mhi2 = low
once mhiindex1 = barindex
once mhiindex2 = barindex

once mlo1 = high
once mlo2 = high
once mloindex1 = barindex
once mloindex2 = barindex

if high >= mhi1 then
mhi1 = high
mhiindex1 = barindex
endif

if low <= mlo1 then
mlo1 = low
mloindex1 = barindex
endif

if openmonth <> openmonth[1] then
mhistart = mhi1
mhistartindex = mhiindex1

if mhi1 >= mhi2 then
mhiadj = (mhi1 - mhi2) / (mhiindex1 - mhiindex2)
mhiend = (mhistart + (mhiadj * (barindex - mhistartindex)))
mhidir = 1
endif

if mhi1 < mhi2 then
mhiadj = (mhi2 - mhi1) / (mhiindex1 - mhiindex2)
mhiend = (mhistart - (mhiadj * (barindex - mhistartindex)))
mhidir = -1
endif

mlostart = mlo1
mlostartindex = mloindex1

if mlo1 >= mlo2 then
mloadj = (mlo1 - mlo2) / (mloindex1 - mloindex2)
mloend = (mlostart + (mloadj * (barindex - mlostartindex)))
mlodir = 1
endif

if mlo1 < mlo2 then
mloadj = (mlo2 - mlo1) / (mloindex1 - mloindex2)
mloend = (mlostart - (mloadj * (barindex - mlostartindex)))
mlodir = -1
endif

mhi2 = mhi1
mhiindex2 = mhiindex1
mhi1 = low
mhiindex1 = barindex
mlo2 = mlo1
mloindex2 = mloindex1
mlo1 = high
mhiindex1 = barindex
endif

if mhidir = 1 then
drawhline(mhiend) coloured (0,128,0,c)
mhistartindex = barindex
mhistart = mhiend
mhiend = (mhistart + (mhiadj * ((barindex+1) - mhistartindex)))
endif

if mhidir = -1 then
drawhline(mhiend) coloured (0,128,0,c)
mhistartindex = barindex
mhistart = mhiend
mhiend = (mhistart - (mhiadj * ((barindex+1) - mhistartindex)))
endif

if mlodir = 1 then
drawhline(mloend) coloured (128,0,0,c)
mlostartindex = barindex
mlostart = mloend
mloend = (mlostart + (mloadj * ((barindex+1) - mlostartindex)))
endif

if mlodir = -1 then
drawhline(mloend) coloured (128,0,0,c)
mlostartindex = barindex
mlostart = mloend
mloend = (mlostart - (mloadj * ((barindex+1) - mlostartindex)))
endif

if values then
mhiendrnd = round(mhiend * 100) / 100
mloendrnd = round(mloend * 100) / 100
DRAWTEXT("#mhiendrnd# M", barindex, mhiend[1], SansSerif, standard, 10) coloured (0,128,0)
DRAWTEXT("#mloendrnd# M", barindex, mloend[1], SansSerif, standard, 10) coloured (128,0,0)
else
DRAWTEXT("M", barindex, mhiend[1], SansSerif, standard, 10) coloured (0,128,0)
DRAWTEXT("M", barindex, mloend[1], SansSerif, standard, 10) coloured (128,0,0)
endif
endif


//Weekly
if w then
once whi1 = low
once whi2 = low
once whiindex1 = barindex
once whiindex2 = barindex

once wlo1 = high
once wlo2 = high
once wloindex1 = barindex
once wloindex2 = barindex

if high >= whi1 then
whi1 = high
whiindex1 = barindex
endif

if low <= wlo1 then
wlo1 = low
wloindex1 = barindex
endif

if opendayofweek < opendayofweek[1] then
whistart = whi1
whistartindex = whiindex1

if whi1 >= whi2 then
whiadj = (whi1 - whi2) / (whiindex1 - whiindex2)
whiend = (whistart + (whiadj * (barindex - whistartindex)))
whidir = 1
endif

if whi1 < whi2 then
whiadj = (whi2 - whi1) / (whiindex1 - whiindex2)
whiend = (whistart - (whiadj * (barindex - whistartindex)))
whidir = -1
endif

wlostart = wlo1
wlostartindex = wloindex1

if wlo1 >= wlo2 then
wloadj = (wlo1 - wlo2) / (wloindex1 - wloindex2)
wloend = (wlostart + (wloadj * (barindex - wlostartindex)))
wlodir = 1
endif

if wlo1 < wlo2 then
wloadj = (wlo2 - wlo1) / (wloindex1 - wloindex2)
wloend = (wlostart - (wloadj * (barindex - wlostartindex)))
wlodir = -1
endif

whi2 = whi1
whiindex2 = whiindex1
whi1 = low
whiindex1 = barindex
wlo2 = wlo1
wloindex2 = wloindex1
wlo1 = high
whiindex1 = barindex
endif

if whidir = 1 then
drawhline(whiend) coloured (0,128,0,c)
whistartindex = barindex
whistart = whiend
whiend = (whistart + (whiadj * ((barindex+1) - whistartindex)))
endif

if whidir = -1 then
drawhline(whiend) coloured (0,128,0,c)
whistartindex = barindex
whistart = whiend
whiend = (whistart - (whiadj * ((barindex+1) - whistartindex)))
endif

if wlodir = 1 then
drawhline(wloend) coloured (128,0,0,c)
wlostartindex = barindex
wlostart = wloend
wloend = (wlostart + (wloadj * ((barindex+1) - wlostartindex)))
endif

if wlodir = -1 then
drawhline(wloend) coloured (128,0,0,c)
wlostartindex = barindex
wlostart = wloend
wloend = (wlostart - (wloadj * ((barindex+1) - wlostartindex)))
endif

if values then
whiendrnd = round(whiend * 100) / 100
wloendrnd = round(wloend * 100) / 100
DRAWTEXT("#whiendrnd# W", barindex, whiend[1], SansSerif, standard, 10) coloured (0,128,0)
DRAWTEXT("#wloendrnd# W", barindex, wloend[1], SansSerif, standard, 10) coloured (128,0,0)
else
DRAWTEXT("W", barindex, whiend[1], SansSerif, standard, 10) coloured (0,128,0)
DRAWTEXT("W", barindex, wloend[1], SansSerif, standard, 10) coloured (128,0,0)
endif
endif


//Daily
if d then
once dhi1 = low
once dhi2 = low
once dhiindex1 = barindex
once dhiindex2 = barindex

once dlo1 = high
once dlo2 = high
once dloindex1 = barindex
once dloindex2 = barindex

if high >= dhi1 then
dhi1 = high
dhiindex1 = barindex
endif

if low <= dlo1 then
dlo1 = low
dloindex1 = barindex
endif

if openday <> openday[1] and openday[1] <> 7 then
dhistart = dhi1
dhistartindex = dhiindex1

if dhi1 >= dhi2 then
dhiadj = (dhi1 - dhi2) / (dhiindex1 - dhiindex2)
dhiend = (dhistart + (dhiadj * (barindex - dhistartindex)))
dhidir = 1
endif

if dhi1 < dhi2 then
dhiadj = (dhi2 - dhi1) / (dhiindex1 - dhiindex2)
dhiend = (dhistart - (dhiadj * (barindex - dhistartindex)))
dhidir = -1
endif

dlostart = dlo1
dlostartindex = dloindex1

if dlo1 >= dlo2 then
dloadj = (dlo1 - dlo2) / (dloindex1 - dloindex2)
dloend = (dlostart + (dloadj * (barindex - dlostartindex)))
dlodir = 1
endif

if dlo1 < dlo2 then
dloadj = (dlo2 - dlo1) / (dloindex1 - dloindex2)
dloend = (dlostart - (dloadj * (barindex - dlostartindex)))
dlodir = -1
endif

dhi2 = dhi1
dhiindex2 = dhiindex1
dhi1 = low
dhiindex1 = barindex
dlo2 = dlo1
dloindex2 = dloindex1
dlo1 = high
dhiindex1 = barindex
endif

if dhidir = 1 then
drawhline(dhiend) coloured (0,128,0,c)
dhistartindex = barindex
dhistart = dhiend
dhiend = (dhistart + (dhiadj * ((barindex+1) - dhistartindex)))
endif

if dhidir = -1 then
drawhline(dhiend) coloured (0,128,0,c)
dhistartindex = barindex
dhistart = dhiend
dhiend = (dhistart - (dhiadj * ((barindex+1) - dhistartindex)))
endif

if dlodir = 1 then
drawhline(dloend) coloured (128,0,0,c)
dlostartindex = barindex
dlostart = dloend
dloend = (dlostart + (dloadj * ((barindex+1) - dlostartindex)))
endif

if dlodir = -1 then
drawhline(dloend) coloured (128,0,0,c)
dlostartindex = barindex
dlostart = dloend
dloend = (dlostart - (dloadj * ((barindex+1) - dlostartindex)))
endif

if values then
dhiendrnd = round(dhiend * 100) / 100
dloendrnd = round(dloend * 100) / 100
DRAWTEXT("#dhiendrnd# D", barindex, dhiend[1], SansSerif, standard, 10) coloured (0,128,0)
DRAWTEXT("#dloendrnd# D", barindex, dloend[1], SansSerif, standard, 10) coloured (128,0,0)
else
DRAWTEXT("D", barindex, dhiend[1], SansSerif, standard, 10) coloured (0,128,0)
DRAWTEXT("D", barindex, dloend[1], SansSerif, standard, 10) coloured (128,0,0)
endif
endif


//H4
if h4 then
once h4hi1 = low
once h4hi2 = low
once h4hiindex1 = barindex
once h4hiindex2 = barindex

once h4lo1 = high
once h4lo2 = high
once h4loindex1 = barindex
once h4loindex2 = barindex

if high >= h4hi1 then
h4hi1 = high
h4hiindex1 = barindex
endif

if low <= h4lo1 then
h4lo1 = low
h4loindex1 = barindex
endif

if openhour <> openhour[1] and (openhour = 1 or openhour = 5 or openhour = 9 or openhour = 13 or openhour = 17 or openhour = 21) then
h4histart = h4hi1
h4histartindex = h4hiindex1

if h4hi1 >= h4hi2 then
h4hiadj = (h4hi1 - h4hi2) / (h4hiindex1 - h4hiindex2)
h4hiend = (h4histart + (h4hiadj * (barindex - h4histartindex)))
h4hidir = 1
endif

if h4hi1 < h4hi2 then
h4hiadj = (h4hi2 - h4hi1) / (h4hiindex1 - h4hiindex2)
h4hiend = (h4histart - (h4hiadj * (barindex - h4histartindex)))
h4hidir = -1
endif

h4lostart = h4lo1
h4lostartindex = h4loindex1

if h4lo1 >= h4lo2 then
h4loadj = (h4lo1 - h4lo2) / (h4loindex1 - h4loindex2)
h4loend = (h4lostart + (h4loadj * (barindex - h4lostartindex)))
h4lodir = 1
endif

if h4lo1 < h4lo2 then
h4loadj = (h4lo2 - h4lo1) / (h4loindex1 - h4loindex2)
h4loend = (h4lostart - (h4loadj * (barindex - h4lostartindex)))
h4lodir = -1
endif

h4hi2 = h4hi1
h4hiindex2 = h4hiindex1
h4hi1 = low
h4hiindex1 = barindex
h4lo2 = h4lo1
h4loindex2 = h4loindex1
h4lo1 = high
h4hiindex1 = barindex
endif

if h4hidir = 1 then
drawhline(h4hiend) coloured (0,128,0,c)
h4histartindex = barindex
h4histart = h4hiend
h4hiend = (h4histart + (h4hiadj * ((barindex+1) - h4histartindex)))
endif

if h4hidir = -1 then
drawhline(h4hiend) coloured (0,128,0,c)
h4histartindex = barindex
h4histart = h4hiend
h4hiend = (h4histart - (h4hiadj * ((barindex+1) - h4histartindex)))
endif

if h4lodir = 1 then
drawhline(h4loend) coloured (128,0,0,c)
h4lostartindex = barindex
h4lostart = h4loend
h4loend = (h4lostart + (h4loadj * ((barindex+1) - h4lostartindex)))
endif

if h4lodir = -1 then
drawhline(h4loend) coloured (128,0,0,c)
h4lostartindex = barindex
h4lostart = h4loend
h4loend = (h4lostart - (h4loadj * ((barindex+1) - h4lostartindex)))
endif

if values then
h4hiendrnd = round(h4hiend * 100) / 100
h4loendrnd = round(h4loend * 100) / 100
DRAWTEXT("#h4hiendrnd# H4", barindex, h4hiend[1], SansSerif, standard, 10) coloured (0,128,0)
DRAWTEXT("#h4loendrnd# H4", barindex, h4loend[1], SansSerif, standard, 10) coloured (128,0,0)
else
DRAWTEXT("H4", barindex, h4hiend[1], SansSerif, standard, 10) coloured (0,128,0)
DRAWTEXT("H4", barindex, h4loend[1], SansSerif, standard, 10) coloured (128,0,0)
endif
endif


//H1
if h1 then
once h1hi1 = low
once h1hi2 = low
once h1hiindex1 = barindex
once h1hiindex2 = barindex

once h1lo1 = high
once h1lo2 = high
once h1loindex1 = barindex
once h1loindex2 = barindex

if high >= h1hi1 then
h1hi1 = high
h1hiindex1 = barindex
endif

if low <= h1lo1 then
h1lo1 = low
h1loindex1 = barindex
endif

if openhour <> openhour[1] then
h1histart = h1hi1
h1histartindex = h1hiindex1

if h1hi1 >= h1hi2 then
h1hiadj = (h1hi1 - h1hi2) / (h1hiindex1 - h1hiindex2)
h1hiend = (h1histart + (h1hiadj * (barindex - h1histartindex)))
h1hidir = 1
endif

if h1hi1 < h1hi2 then
h1hiadj = (h1hi2 - h1hi1) / (h1hiindex1 - h1hiindex2)
h1hiend = (h1histart - (h1hiadj * (barindex - h1histartindex)))
h1hidir = -1
endif

h1lostart = h1lo1
h1lostartindex = h1loindex1

if h1lo1 >= h1lo2 then
h1loadj = (h1lo1 - h1lo2) / (h1loindex1 - h1loindex2)
h1loend = (h1lostart + (h1loadj * (barindex - h1lostartindex)))
h1lodir = 1
endif

if h1lo1 < h1lo2 then
h1loadj = (h1lo2 - h1lo1) / (h1loindex1 - h1loindex2)
h1loend = (h1lostart - (h1loadj * (barindex - h1lostartindex)))
h1lodir = -1
endif

h1hi2 = h1hi1
h1hiindex2 = h1hiindex1
h1hi1 = low
h1hiindex1 = barindex
h1lo2 = h1lo1
h1loindex2 = h1loindex1
h1lo1 = high
h1hiindex1 = barindex
endif

if h1hidir = 1 then
drawhline(h1hiend) coloured (0,128,0,c)
h1histartindex = barindex
h1histart = h1hiend
h1hiend = (h1histart + (h1hiadj * ((barindex+1) - h1histartindex)))
endif

if h1hidir = -1 then
drawhline(h1hiend) coloured (0,128,0,c)
h1histartindex = barindex
h1histart = h1hiend
h1hiend = (h1histart - (h1hiadj * ((barindex+1) - h1histartindex)))
endif

if h1lodir = 1 then
drawhline(h1loend) coloured (128,0,0,c)
h1lostartindex = barindex
h1lostart = h1loend
h1loend = (h1lostart + (h1loadj * ((barindex+1) - h1lostartindex)))
endif

if h1lodir = -1 then
drawhline(h1loend) coloured (128,0,0,c)
h1lostartindex = barindex
h1lostart = h1loend
h1loend = (h1lostart - (h1loadj * ((barindex+1) - h1lostartindex)))
endif

if values then
h1hiendrnd = round(h1hiend * 100) / 100
h1loendrnd = round(h1loend * 100) / 100
DRAWTEXT("#h1hiendrnd# H1", barindex, h1hiend[1], SansSerif, standard, 10) coloured (0,128,0)
DRAWTEXT("#h1loendrnd# H1", barindex, h1loend[1], SansSerif, standard, 10) coloured (128,0,0)
else
DRAWTEXT("H1", barindex, h1hiend[1], SansSerif, standard, 10) coloured (0,128,0)
DRAWTEXT("H1", barindex, h1loend[1], SansSerif, standard, 10) coloured (128,0,0)
endif
endif

return