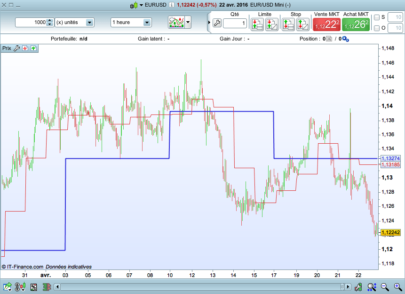
This indicator does the same calculations as my ‘Last Two Highest High and Lowest Low Horizontal Lines – Yearly Quarterly, Monthly, Weekly, Daily, 4 Hour and 1 Hour’ indicator but displays the results only on the last bar as a horizontal line where the latest projection is calculated to be.
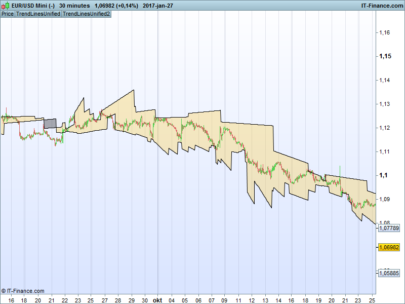
At the start of a new period this indicator calculates lines connecting the previous two periods highest highs and previous two lowest lows. It then projects these lines forward throughout the latest period and draws horizontal lines on the chart at the latest projection values.
It can find the last two yearly, quarterly, monthly, weekly, daily, 4 hourly and 1 hourly highest highs and lowest lows and calculates how those lines would project forward At the start of a new year, quarter, month, week, day, 4 hour period, 1 hour period new lines and their projections forward are calculated.
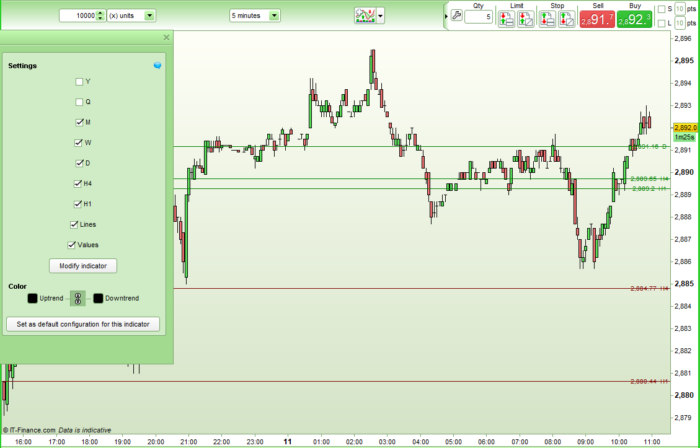
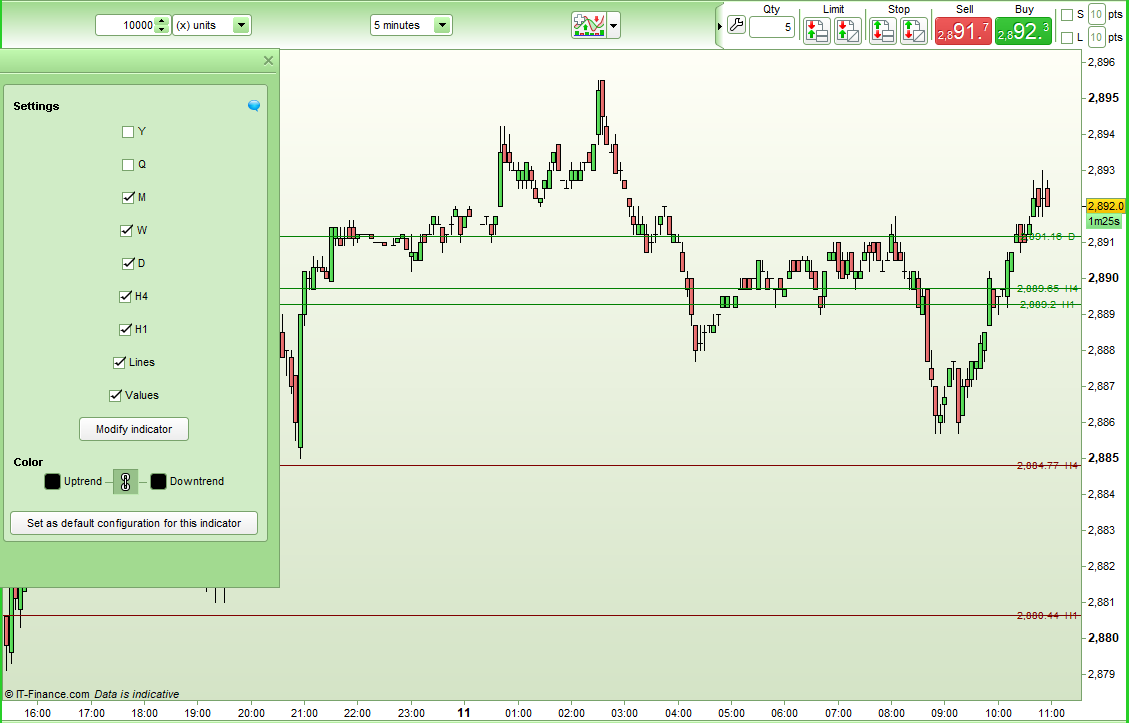
Values for the latest projection are shown. These can be turned off with the ‘Values’ setting.
You can turn on or off the lines using the ‘Lines’ setting.
The indicator can be used on any time frame chart but if there is not enough data to provide two HH or two LL then it won’t draw any lines for that time period. You can only draw slower time frame lines on a faster time frame chart so for example you obviously cannot draw H1 lines a daily chart
For daily calculations Sunday candles are included in Fridays data so the projected lines on a Monday are from the Thursday daily HH and daily LL and the daily HH and daily LL of Friday and Sunday combined. Weeks start at the open of the Sunday candle.
Each line is labelled. If you add this indicator to the same chart as my ‘Last Two Highest High and Lowest Low Lines – Yearly Quarterly, Monthly, Weekly, Daily, 4 Hour and 1 Hour’ indicator and turn off the lines and values then it can provide up to date labels for that indicator.
Apply to the price chart
The lines can be used as support and resistance or for breakout trading – however you wish.
It will be slow to draw if you apply it to a lot of historical bars.
I suggest downloading and importing the indicator to get full functionality.
|
1 2 3 4 5 6 7 8 9 10 11 12 13 14 15 16 17 18 19 20 21 22 23 24 25 26 27 28 29 30 31 32 33 34 35 36 37 38 39 40 41 42 43 44 45 46 47 48 49 50 51 52 53 54 55 56 57 58 59 60 61 62 63 64 65 66 67 68 69 70 71 72 73 74 75 76 77 78 79 80 81 82 83 84 85 86 87 88 89 90 91 92 93 94 95 96 97 98 99 100 101 102 103 104 105 106 107 108 109 110 111 112 113 114 115 116 117 118 119 120 121 122 123 124 125 126 127 128 129 130 131 132 133 134 135 136 137 138 139 140 141 142 143 144 145 146 147 148 149 150 151 152 153 154 155 156 157 158 159 160 161 162 163 164 165 166 167 168 169 170 171 172 173 174 175 176 177 178 179 180 181 182 183 184 185 186 187 188 189 190 191 192 193 194 195 196 197 198 199 200 201 202 203 204 205 206 207 208 209 210 211 212 213 214 215 216 217 218 219 220 221 222 223 224 225 226 227 228 229 230 231 232 233 234 235 236 237 238 239 240 241 242 243 244 245 246 247 248 249 250 251 252 253 254 255 256 257 258 259 260 261 262 263 264 265 266 267 268 269 270 271 272 273 274 275 276 277 278 279 280 281 282 283 284 285 286 287 288 289 290 291 292 293 294 295 296 297 298 299 300 301 302 303 304 305 306 307 308 309 310 311 312 313 314 315 316 317 318 319 320 321 322 323 324 325 326 327 328 329 330 331 332 333 334 335 336 337 338 339 340 341 342 343 344 345 346 347 348 349 350 351 352 353 354 355 356 357 358 359 360 361 362 363 364 365 366 367 368 369 370 371 372 373 374 375 376 377 378 379 380 381 382 383 384 385 386 387 388 389 390 391 392 393 394 395 396 397 398 399 400 401 402 403 404 405 406 407 408 409 410 411 412 413 414 415 416 417 418 419 420 421 422 423 424 425 426 427 428 429 430 431 432 433 434 435 436 437 438 439 440 441 442 443 444 445 446 447 448 449 450 451 452 453 454 455 456 457 458 459 460 461 462 463 464 465 466 467 468 469 470 471 472 473 474 475 476 477 478 479 480 481 482 483 484 485 486 487 488 489 490 491 492 493 494 495 496 497 498 499 500 501 502 503 504 505 506 507 508 509 510 511 512 513 514 515 516 517 518 519 520 521 522 523 524 525 526 527 528 529 530 531 532 533 534 535 536 537 538 539 540 541 542 543 544 545 546 547 548 549 550 551 552 553 554 555 556 557 558 559 560 561 562 563 564 565 566 567 568 569 570 571 572 573 574 575 576 577 578 579 580 581 582 583 584 585 586 587 588 589 590 591 592 593 594 595 596 597 598 599 600 601 602 603 604 605 606 607 608 609 610 611 612 613 614 615 616 617 618 619 620 621 622 623 624 625 626 627 628 629 630 631 632 633 634 635 636 637 638 639 640 641 642 643 644 645 646 647 648 649 650 651 652 653 654 655 656 657 658 659 660 661 662 663 664 665 666 667 668 669 670 671 672 673 674 675 676 677 678 679 680 681 682 683 684 685 686 687 688 689 690 691 692 693 694 695 696 697 698 699 700 701 702 703 704 705 706 707 708 709 710 711 712 713 714 715 716 717 718 719 720 721 722 723 724 725 726 727 728 729 730 731 732 733 734 735 736 737 738 739 740 741 |
//Last Two HH LL Lines Horizontal //Coded by Vonasi //Date 20190411 defparam drawonlastbaronly = true //Y = 0 //Q = 0 //M = 1 //W = 0 //D = 0 //H4 = 0 //H1 = 0 //Lines = 1 //Values = 1 c = 0 if lines then c = 255 endif //Yearly if y then once yhi1 = low once yhi2 = low once yhiindex1 = barindex once yhiindex2 = barindex once ylo1 = high once ylo2 = high once yloindex1 = barindex once yloindex2 = barindex if high >= yhi1 then yhi1 = high yhiindex1 = barindex endif if low <= ylo1 then ylo1 = low yloindex1 = barindex endif if openyear <> openyear[1] then yhistart = yhi1 yhistartindex = yhiindex1 if yhi1 >= yhi2 then yhiadj = (yhi1 - yhi2) / (yhiindex1 - yhiindex2) yhiend = (yhistart + (yhiadj * (barindex - yhistartindex))) yhidir = 1 endif if yhi1 < yhi2 then yhiadj = (yhi2 - yhi1) / (yhiindex1 - yhiindex2) yhiend = (yhistart - (yhiadj * (barindex - yhistartindex))) yhidir = -1 endif ylostart = ylo1 ylostartindex = yloindex1 if ylo1 >= ylo2 then yloadj = (ylo1 - ylo2) / (yloindex1 - yloindex2) yloend = (ylostart + (yloadj * (barindex - ylostartindex))) ylodir = 1 endif if ylo1 < ylo2 then yloadj = (ylo2 - ylo1) / (yloindex1 - yloindex2) yloend = (ylostart - (yloadj * (barindex - ylostartindex))) ylodir = -1 endif yhi2 = yhi1 yhiindex2 = yhiindex1 yhi1 = low yhiindex1 = barindex ylo2 = ylo1 yloindex2 = yloindex1 ylo1 = high yhiindex1 = barindex endif if yhidir = 1 then drawhline(yhiend) coloured (0,128,0,c) yhistartindex = barindex yhistart = yhiend yhiend = (yhistart + (yhiadj * ((barindex+1) - yhistartindex))) endif if yhidir = -1 then drawhline(yhiend) coloured (0,128,0,c) yhistartindex = barindex yhistart = yhiend yhiend = (yhistart - (yhiadj * ((barindex+1) - yhistartindex))) endif if ylodir = 1 then drawhline(yloend) coloured (128,0,0,c) ylostartindex = barindex ylostart = yloend yloend = (ylostart + (yloadj * ((barindex+1) - ylostartindex))) endif if ylodir = -1 then drawhline(yloend) coloured (128,0,0,c) ylostartindex = barindex ylostart = yloend yloend = (ylostart - (yloadj * ((barindex+1) - ylostartindex))) endif if values then yhiendrnd = round(yhiend * 100) / 100 yloendrnd = round(yloend * 100) / 100 DRAWTEXT("#yhiendrnd# Y", barindex, yhiend[1], SansSerif, standard, 10) coloured (0,128,0) DRAWTEXT("#yloendrnd# Y", barindex, yloend[1], SansSerif, standard, 10) coloured (128,0,0) else DRAWTEXT("Y", barindex, yhiend[1], SansSerif, standard, 10) coloured (0,128,0) DRAWTEXT("Y", barindex, yloend[1], SansSerif, standard, 10) coloured (128,0,0) endif endif //Quarterly if q then once qhi1 = low once qhi2 = low once qhiindex1 = barindex once qhiindex2 = barindex once qlo1 = high once qlo2 = high once qloindex1 = barindex once qloindex2 = barindex if high >= qhi1 then qhi1 = high qhiindex1 = barindex endif if low <= qlo1 then qlo1 = low qloindex1 = barindex endif if openmonth <> openmonth[1] and (openmonth = 1 or openmonth = 4 or openmonth = 7 or openmonth = 10) then qhistart = qhi1 qhistartindex = qhiindex1 if qhi1 >= qhi2 then qhiadj = (qhi1 - qhi2) / (qhiindex1 - qhiindex2) qhiend = (qhistart + (qhiadj * (barindex - qhistartindex))) qhidir = 1 endif if qhi1 < qhi2 then qhiadj = (qhi2 - qhi1) / (qhiindex1 - qhiindex2) qhiend = (qhistart - (qhiadj * (barindex - qhistartindex))) qhidir = -1 endif qlostart = qlo1 qlostartindex = qloindex1 if qlo1 >= qlo2 then qloadj = (qlo1 - qlo2) / (qloindex1 - qloindex2) qloend = (qlostart + (qloadj * (barindex - qlostartindex))) qlodir = 1 endif if qlo1 < qlo2 then qloadj = (qlo2 - qlo1) / (qloindex1 - qloindex2) qloend = (qlostart - (qloadj * (barindex - qlostartindex))) qlodir = -1 endif qhi2 = qhi1 qhiindex2 = qhiindex1 qhi1 = low qhiindex1 = barindex qlo2 = qlo1 qloindex2 = qloindex1 qlo1 = high qhiindex1 = barindex endif if qhidir = 1 then drawhline(qhiend) coloured (0,128,0,c) qhistartindex = barindex qhistart = qhiend qhiend = (qhistart + (qhiadj * ((barindex+1) - qhistartindex))) endif if qhidir = -1 then drawhline(qhiend) coloured (0,128,0,c) qhistartindex = barindex qhistart = qhiend qhiend = (qhistart - (qhiadj * ((barindex+1) - qhistartindex))) endif if qlodir = 1 then drawhline(qloend) coloured (128,0,0,c) qlostartindex = barindex qlostart = qloend qloend = (qlostart + (qloadj * ((barindex+1) - qlostartindex))) endif if qlodir = -1 then drawhline(qloend) coloured (128,0,0,c) qlostartindex = barindex qlostart = qloend qloend = (qlostart - (qloadj * ((barindex+1) - qlostartindex))) endif if values then qhiendrnd = round(qhiend * 100) / 100 qloendrnd = round(qloend * 100) / 100 DRAWTEXT("#qhiendrnd# Q", barindex, qhiend[1], SansSerif, standard, 10) coloured (0,128,0) DRAWTEXT("#qloendrnd# Q", barindex, qloend[1], SansSerif, standard, 10) coloured (128,0,0) else DRAWTEXT("Q", barindex, qhiend[1], SansSerif, standard, 10) coloured (0,128,0) DRAWTEXT("Q", barindex, qloend[1], SansSerif, standard, 10) coloured (128,0,0) endif endif //Monthly if m then once mhi1 = low once mhi2 = low once mhiindex1 = barindex once mhiindex2 = barindex once mlo1 = high once mlo2 = high once mloindex1 = barindex once mloindex2 = barindex if high >= mhi1 then mhi1 = high mhiindex1 = barindex endif if low <= mlo1 then mlo1 = low mloindex1 = barindex endif if openmonth <> openmonth[1] then mhistart = mhi1 mhistartindex = mhiindex1 if mhi1 >= mhi2 then mhiadj = (mhi1 - mhi2) / (mhiindex1 - mhiindex2) mhiend = (mhistart + (mhiadj * (barindex - mhistartindex))) mhidir = 1 endif if mhi1 < mhi2 then mhiadj = (mhi2 - mhi1) / (mhiindex1 - mhiindex2) mhiend = (mhistart - (mhiadj * (barindex - mhistartindex))) mhidir = -1 endif mlostart = mlo1 mlostartindex = mloindex1 if mlo1 >= mlo2 then mloadj = (mlo1 - mlo2) / (mloindex1 - mloindex2) mloend = (mlostart + (mloadj * (barindex - mlostartindex))) mlodir = 1 endif if mlo1 < mlo2 then mloadj = (mlo2 - mlo1) / (mloindex1 - mloindex2) mloend = (mlostart - (mloadj * (barindex - mlostartindex))) mlodir = -1 endif mhi2 = mhi1 mhiindex2 = mhiindex1 mhi1 = low mhiindex1 = barindex mlo2 = mlo1 mloindex2 = mloindex1 mlo1 = high mhiindex1 = barindex endif if mhidir = 1 then drawhline(mhiend) coloured (0,128,0,c) mhistartindex = barindex mhistart = mhiend mhiend = (mhistart + (mhiadj * ((barindex+1) - mhistartindex))) endif if mhidir = -1 then drawhline(mhiend) coloured (0,128,0,c) mhistartindex = barindex mhistart = mhiend mhiend = (mhistart - (mhiadj * ((barindex+1) - mhistartindex))) endif if mlodir = 1 then drawhline(mloend) coloured (128,0,0,c) mlostartindex = barindex mlostart = mloend mloend = (mlostart + (mloadj * ((barindex+1) - mlostartindex))) endif if mlodir = -1 then drawhline(mloend) coloured (128,0,0,c) mlostartindex = barindex mlostart = mloend mloend = (mlostart - (mloadj * ((barindex+1) - mlostartindex))) endif if values then mhiendrnd = round(mhiend * 100) / 100 mloendrnd = round(mloend * 100) / 100 DRAWTEXT("#mhiendrnd# M", barindex, mhiend[1], SansSerif, standard, 10) coloured (0,128,0) DRAWTEXT("#mloendrnd# M", barindex, mloend[1], SansSerif, standard, 10) coloured (128,0,0) else DRAWTEXT("M", barindex, mhiend[1], SansSerif, standard, 10) coloured (0,128,0) DRAWTEXT("M", barindex, mloend[1], SansSerif, standard, 10) coloured (128,0,0) endif endif //Weekly if w then once whi1 = low once whi2 = low once whiindex1 = barindex once whiindex2 = barindex once wlo1 = high once wlo2 = high once wloindex1 = barindex once wloindex2 = barindex if high >= whi1 then whi1 = high whiindex1 = barindex endif if low <= wlo1 then wlo1 = low wloindex1 = barindex endif if opendayofweek < opendayofweek[1] then whistart = whi1 whistartindex = whiindex1 if whi1 >= whi2 then whiadj = (whi1 - whi2) / (whiindex1 - whiindex2) whiend = (whistart + (whiadj * (barindex - whistartindex))) whidir = 1 endif if whi1 < whi2 then whiadj = (whi2 - whi1) / (whiindex1 - whiindex2) whiend = (whistart - (whiadj * (barindex - whistartindex))) whidir = -1 endif wlostart = wlo1 wlostartindex = wloindex1 if wlo1 >= wlo2 then wloadj = (wlo1 - wlo2) / (wloindex1 - wloindex2) wloend = (wlostart + (wloadj * (barindex - wlostartindex))) wlodir = 1 endif if wlo1 < wlo2 then wloadj = (wlo2 - wlo1) / (wloindex1 - wloindex2) wloend = (wlostart - (wloadj * (barindex - wlostartindex))) wlodir = -1 endif whi2 = whi1 whiindex2 = whiindex1 whi1 = low whiindex1 = barindex wlo2 = wlo1 wloindex2 = wloindex1 wlo1 = high whiindex1 = barindex endif if whidir = 1 then drawhline(whiend) coloured (0,128,0,c) whistartindex = barindex whistart = whiend whiend = (whistart + (whiadj * ((barindex+1) - whistartindex))) endif if whidir = -1 then drawhline(whiend) coloured (0,128,0,c) whistartindex = barindex whistart = whiend whiend = (whistart - (whiadj * ((barindex+1) - whistartindex))) endif if wlodir = 1 then drawhline(wloend) coloured (128,0,0,c) wlostartindex = barindex wlostart = wloend wloend = (wlostart + (wloadj * ((barindex+1) - wlostartindex))) endif if wlodir = -1 then drawhline(wloend) coloured (128,0,0,c) wlostartindex = barindex wlostart = wloend wloend = (wlostart - (wloadj * ((barindex+1) - wlostartindex))) endif if values then whiendrnd = round(whiend * 100) / 100 wloendrnd = round(wloend * 100) / 100 DRAWTEXT("#whiendrnd# W", barindex, whiend[1], SansSerif, standard, 10) coloured (0,128,0) DRAWTEXT("#wloendrnd# W", barindex, wloend[1], SansSerif, standard, 10) coloured (128,0,0) else DRAWTEXT("W", barindex, whiend[1], SansSerif, standard, 10) coloured (0,128,0) DRAWTEXT("W", barindex, wloend[1], SansSerif, standard, 10) coloured (128,0,0) endif endif //Daily if d then once dhi1 = low once dhi2 = low once dhiindex1 = barindex once dhiindex2 = barindex once dlo1 = high once dlo2 = high once dloindex1 = barindex once dloindex2 = barindex if high >= dhi1 then dhi1 = high dhiindex1 = barindex endif if low <= dlo1 then dlo1 = low dloindex1 = barindex endif if openday <> openday[1] and openday[1] <> 7 then dhistart = dhi1 dhistartindex = dhiindex1 if dhi1 >= dhi2 then dhiadj = (dhi1 - dhi2) / (dhiindex1 - dhiindex2) dhiend = (dhistart + (dhiadj * (barindex - dhistartindex))) dhidir = 1 endif if dhi1 < dhi2 then dhiadj = (dhi2 - dhi1) / (dhiindex1 - dhiindex2) dhiend = (dhistart - (dhiadj * (barindex - dhistartindex))) dhidir = -1 endif dlostart = dlo1 dlostartindex = dloindex1 if dlo1 >= dlo2 then dloadj = (dlo1 - dlo2) / (dloindex1 - dloindex2) dloend = (dlostart + (dloadj * (barindex - dlostartindex))) dlodir = 1 endif if dlo1 < dlo2 then dloadj = (dlo2 - dlo1) / (dloindex1 - dloindex2) dloend = (dlostart - (dloadj * (barindex - dlostartindex))) dlodir = -1 endif dhi2 = dhi1 dhiindex2 = dhiindex1 dhi1 = low dhiindex1 = barindex dlo2 = dlo1 dloindex2 = dloindex1 dlo1 = high dhiindex1 = barindex endif if dhidir = 1 then drawhline(dhiend) coloured (0,128,0,c) dhistartindex = barindex dhistart = dhiend dhiend = (dhistart + (dhiadj * ((barindex+1) - dhistartindex))) endif if dhidir = -1 then drawhline(dhiend) coloured (0,128,0,c) dhistartindex = barindex dhistart = dhiend dhiend = (dhistart - (dhiadj * ((barindex+1) - dhistartindex))) endif if dlodir = 1 then drawhline(dloend) coloured (128,0,0,c) dlostartindex = barindex dlostart = dloend dloend = (dlostart + (dloadj * ((barindex+1) - dlostartindex))) endif if dlodir = -1 then drawhline(dloend) coloured (128,0,0,c) dlostartindex = barindex dlostart = dloend dloend = (dlostart - (dloadj * ((barindex+1) - dlostartindex))) endif if values then dhiendrnd = round(dhiend * 100) / 100 dloendrnd = round(dloend * 100) / 100 DRAWTEXT("#dhiendrnd# D", barindex, dhiend[1], SansSerif, standard, 10) coloured (0,128,0) DRAWTEXT("#dloendrnd# D", barindex, dloend[1], SansSerif, standard, 10) coloured (128,0,0) else DRAWTEXT("D", barindex, dhiend[1], SansSerif, standard, 10) coloured (0,128,0) DRAWTEXT("D", barindex, dloend[1], SansSerif, standard, 10) coloured (128,0,0) endif endif //H4 if h4 then once h4hi1 = low once h4hi2 = low once h4hiindex1 = barindex once h4hiindex2 = barindex once h4lo1 = high once h4lo2 = high once h4loindex1 = barindex once h4loindex2 = barindex if high >= h4hi1 then h4hi1 = high h4hiindex1 = barindex endif if low <= h4lo1 then h4lo1 = low h4loindex1 = barindex endif if openhour <> openhour[1] and (openhour = 1 or openhour = 5 or openhour = 9 or openhour = 13 or openhour = 17 or openhour = 21) then h4histart = h4hi1 h4histartindex = h4hiindex1 if h4hi1 >= h4hi2 then h4hiadj = (h4hi1 - h4hi2) / (h4hiindex1 - h4hiindex2) h4hiend = (h4histart + (h4hiadj * (barindex - h4histartindex))) h4hidir = 1 endif if h4hi1 < h4hi2 then h4hiadj = (h4hi2 - h4hi1) / (h4hiindex1 - h4hiindex2) h4hiend = (h4histart - (h4hiadj * (barindex - h4histartindex))) h4hidir = -1 endif h4lostart = h4lo1 h4lostartindex = h4loindex1 if h4lo1 >= h4lo2 then h4loadj = (h4lo1 - h4lo2) / (h4loindex1 - h4loindex2) h4loend = (h4lostart + (h4loadj * (barindex - h4lostartindex))) h4lodir = 1 endif if h4lo1 < h4lo2 then h4loadj = (h4lo2 - h4lo1) / (h4loindex1 - h4loindex2) h4loend = (h4lostart - (h4loadj * (barindex - h4lostartindex))) h4lodir = -1 endif h4hi2 = h4hi1 h4hiindex2 = h4hiindex1 h4hi1 = low h4hiindex1 = barindex h4lo2 = h4lo1 h4loindex2 = h4loindex1 h4lo1 = high h4hiindex1 = barindex endif if h4hidir = 1 then drawhline(h4hiend) coloured (0,128,0,c) h4histartindex = barindex h4histart = h4hiend h4hiend = (h4histart + (h4hiadj * ((barindex+1) - h4histartindex))) endif if h4hidir = -1 then drawhline(h4hiend) coloured (0,128,0,c) h4histartindex = barindex h4histart = h4hiend h4hiend = (h4histart - (h4hiadj * ((barindex+1) - h4histartindex))) endif if h4lodir = 1 then drawhline(h4loend) coloured (128,0,0,c) h4lostartindex = barindex h4lostart = h4loend h4loend = (h4lostart + (h4loadj * ((barindex+1) - h4lostartindex))) endif if h4lodir = -1 then drawhline(h4loend) coloured (128,0,0,c) h4lostartindex = barindex h4lostart = h4loend h4loend = (h4lostart - (h4loadj * ((barindex+1) - h4lostartindex))) endif if values then h4hiendrnd = round(h4hiend * 100) / 100 h4loendrnd = round(h4loend * 100) / 100 DRAWTEXT("#h4hiendrnd# H4", barindex, h4hiend[1], SansSerif, standard, 10) coloured (0,128,0) DRAWTEXT("#h4loendrnd# H4", barindex, h4loend[1], SansSerif, standard, 10) coloured (128,0,0) else DRAWTEXT("H4", barindex, h4hiend[1], SansSerif, standard, 10) coloured (0,128,0) DRAWTEXT("H4", barindex, h4loend[1], SansSerif, standard, 10) coloured (128,0,0) endif endif //H1 if h1 then once h1hi1 = low once h1hi2 = low once h1hiindex1 = barindex once h1hiindex2 = barindex once h1lo1 = high once h1lo2 = high once h1loindex1 = barindex once h1loindex2 = barindex if high >= h1hi1 then h1hi1 = high h1hiindex1 = barindex endif if low <= h1lo1 then h1lo1 = low h1loindex1 = barindex endif if openhour <> openhour[1] then h1histart = h1hi1 h1histartindex = h1hiindex1 if h1hi1 >= h1hi2 then h1hiadj = (h1hi1 - h1hi2) / (h1hiindex1 - h1hiindex2) h1hiend = (h1histart + (h1hiadj * (barindex - h1histartindex))) h1hidir = 1 endif if h1hi1 < h1hi2 then h1hiadj = (h1hi2 - h1hi1) / (h1hiindex1 - h1hiindex2) h1hiend = (h1histart - (h1hiadj * (barindex - h1histartindex))) h1hidir = -1 endif h1lostart = h1lo1 h1lostartindex = h1loindex1 if h1lo1 >= h1lo2 then h1loadj = (h1lo1 - h1lo2) / (h1loindex1 - h1loindex2) h1loend = (h1lostart + (h1loadj * (barindex - h1lostartindex))) h1lodir = 1 endif if h1lo1 < h1lo2 then h1loadj = (h1lo2 - h1lo1) / (h1loindex1 - h1loindex2) h1loend = (h1lostart - (h1loadj * (barindex - h1lostartindex))) h1lodir = -1 endif h1hi2 = h1hi1 h1hiindex2 = h1hiindex1 h1hi1 = low h1hiindex1 = barindex h1lo2 = h1lo1 h1loindex2 = h1loindex1 h1lo1 = high h1hiindex1 = barindex endif if h1hidir = 1 then drawhline(h1hiend) coloured (0,128,0,c) h1histartindex = barindex h1histart = h1hiend h1hiend = (h1histart + (h1hiadj * ((barindex+1) - h1histartindex))) endif if h1hidir = -1 then drawhline(h1hiend) coloured (0,128,0,c) h1histartindex = barindex h1histart = h1hiend h1hiend = (h1histart - (h1hiadj * ((barindex+1) - h1histartindex))) endif if h1lodir = 1 then drawhline(h1loend) coloured (128,0,0,c) h1lostartindex = barindex h1lostart = h1loend h1loend = (h1lostart + (h1loadj * ((barindex+1) - h1lostartindex))) endif if h1lodir = -1 then drawhline(h1loend) coloured (128,0,0,c) h1lostartindex = barindex h1lostart = h1loend h1loend = (h1lostart - (h1loadj * ((barindex+1) - h1lostartindex))) endif if values then h1hiendrnd = round(h1hiend * 100) / 100 h1loendrnd = round(h1loend * 100) / 100 DRAWTEXT("#h1hiendrnd# H1", barindex, h1hiend[1], SansSerif, standard, 10) coloured (0,128,0) DRAWTEXT("#h1loendrnd# H1", barindex, h1loend[1], SansSerif, standard, 10) coloured (128,0,0) else DRAWTEXT("H1", barindex, h1hiend[1], SansSerif, standard, 10) coloured (0,128,0) DRAWTEXT("H1", barindex, h1loend[1], SansSerif, standard, 10) coloured (128,0,0) endif endif return |
Share this
No information on this site is investment advice or a solicitation to buy or sell any financial instrument. Past performance is not indicative of future results. Trading may expose you to risk of loss greater than your deposits and is only suitable for experienced investors who have sufficient financial means to bear such risk.
ProRealTime ITF files and other attachments :PRC is also on YouTube, subscribe to our channel for exclusive content and tutorials

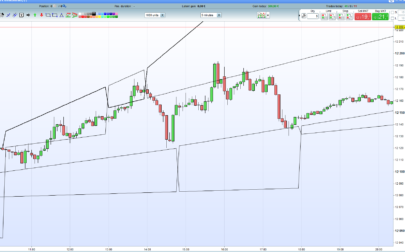
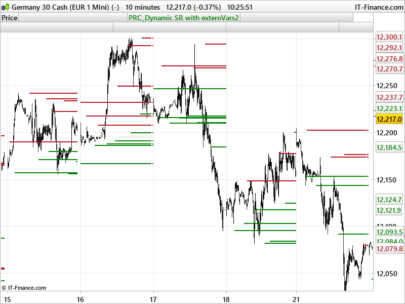
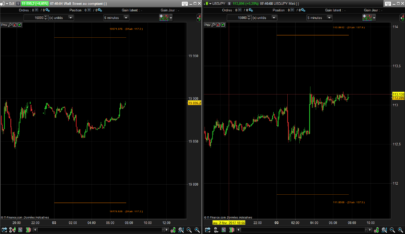


There has been a minor bug fix as lines were drawn incorrectly if both HH or both LL values were identical. The code and ITF file in this library post have been updated. Anyone who has already downloaded or copied the code should now download v1.1 or copy the amended code found here.
Excellent, i was looking for something like that, but could be great if you add the option to switch from High/Low to Open/Close because they are very sensitive retracement levels for scalping!
Thank you very much
Thank U for ur sharing Vonasi
Hello Vonasi, I tried it but it does not seem to work,any idea why ? Thanks,Jan
defparam drawonlastbaronly = true
//Y = 0
//Q = 0
//M = 1
//W = 0
//D = 0
//H4 = 0
//H1 = 0
//Lines = 1
//Values = 1
Hello is it possible to add the m15? Thank you
It is possible but I will need to reread the code and remind myself how it works as I coded it a log time ago! I’ll add it to my list.
hello dear Vonasi, thank you for your indicator, can I ask you for some help in order to let your indicator work on my platform?thank you in advance GIoia i am an italian trader who lives in Italy
HI Vonasi I would like to know how can this algorithm give me the value of the last max e min over a period of time.
THank you very much
Hello Vonasi,
Great work. Is it possible to replicate this to get values of “Price Line” (1 hour, 4 hour and Daily high and low) so that we can develop signals on these lines for long/ short please?
Many thanks.