Higher time frame Heikin Ashi candles on a lower time frame chart

v10.3
Higher time frame Heikin Ashi candles on a lower time frame chart

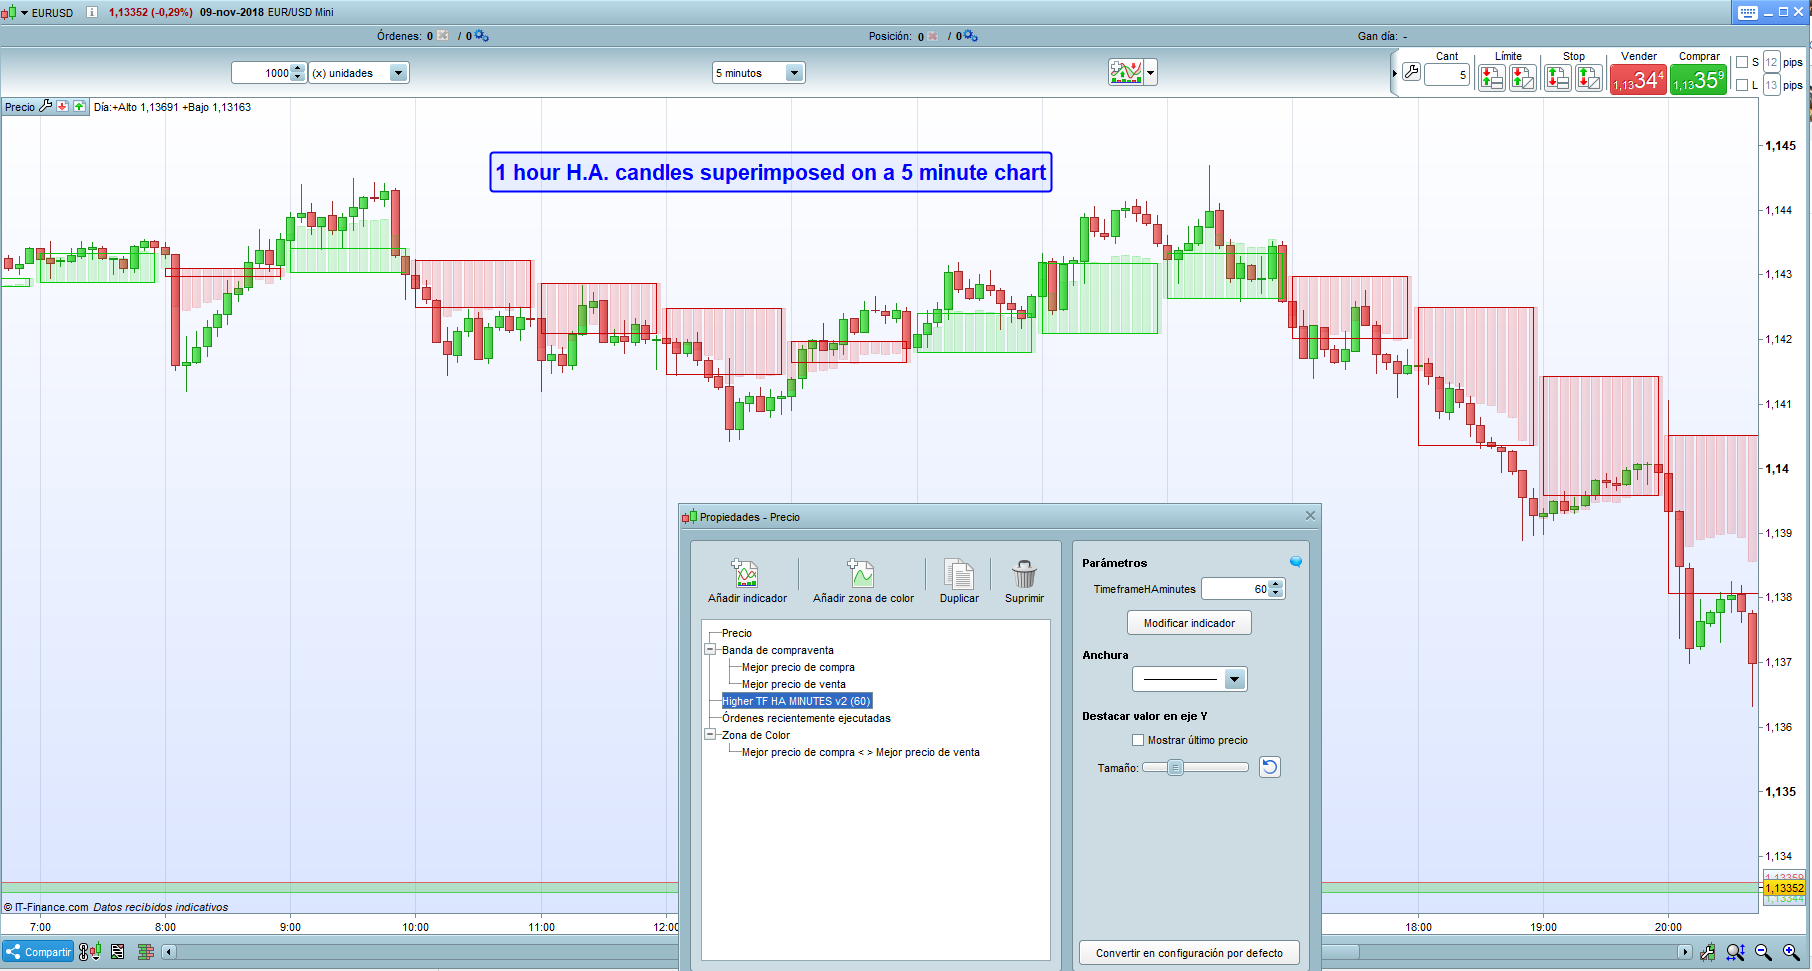
This indicator is based on an idea of Nicolas (= heikin ashi of higher TF ), with the difference that the Heikin Ashi candles of a higher time-frame are now superimposed on the price window of a given TF. Heikin Ashi candles are wonderful to filter the noise in the quotes and allow to see more clearly the underlying trend.The period of the upper TF candles are set in minutes (1 Hour 60, 4 hours 240, one day 1440 etc.)The HA candle is drawn as a rectangle and inside the rectangle we can see next to the price bars other small bars that show us how the HA candle of the TF has evolved over time.


Share this

Risk disclosure:

No information on this site is investment advice or a solicitation to buy or sell any financial instrument. Past performance is not indicative of future results. Trading may expose you to risk of loss greater than your deposits and is only suitable for experienced investors who have sufficient financial means to bear such risk.

ProRealTime ITF files and other attachments : How to import ITF files into ProRealTime platform?

PRC is also on YouTube, subscribe to our channel for exclusive content and tutorials

  1. Matriciel • 11/11/2018 #

    Well done, good job ! 😉

  2. rollem • 11/11/2018 #

    Thank you! Could you replicate this indicator using regular candlesticks instead of Heikin Ashi? I would appreciate it if you could!

    • pableitor • 11/11/2018 #

      Done ! Pls check this https://www.prorealcode.com/prorealtime-indicators/higher-time-frame-candlestick-on-a-lower-time-frame-chart/

  3. rollem • 11/11/2018 #

    Thank you very much sir!

  4. Jean-Claude REGIS • 11/11/2018 #

    Il doit être possible tout simplement d’emprisonner les bougies dans des rectangles (+haut +bas et UT) d’unité de temps supérieures je ne saurais pas le coder donc ….. ex sur graph 5M rectangles pour les UT 15M H1 D1 d’un seul coup d’oeil cela permettrait de visualiser l’amplitude et la position du prix sur chaque UT ainsi que la tendance de fond et celle du moment cordialement

    • Nicolas • 11/11/2018 #

      oui c’est possible. Cependant la position du prix,c’est la même sur chaque UT 😉

  5. Jean-Claude REGIS • 11/11/2018 #

    Merci Nicolas de la rep oui bien sur que le prix a une position identique le but est d’avoir tout sur un seul graph (plus hauts + bas par unité de temps )

  6. cv • 11/11/2018 #

    Hi All, I am not very knowledgeable with coding. I have tried to add this indicator and get the following message –
    Syntax error: The following variable is undefined: timeframehaminutes.
    I would really appreciate it if someone could tell me what I need to do to fix this.
    Thank you
    Corinne

    • Nicolas • 11/11/2018 #

      Download the .itf file and import it into the platform, you’ll get all the necessary settings that way.

  7. Guibourse • 11/11/2018 #

    Hi, I don’t know why but I cannot add the 1 minute Heikin candles on a 100 ticks TF (but the 2 minutes or more works)

    • pableitor • 11/11/2018 #

      Hi, this indicator was programmed for PRT 10.3 , I had to do the high TF detection by software which was difficult specially for the lower TF (seconds or ticks). The new timeframe instructions are easier to work with. Will update it ASAP to PRT 11

avatar
Register or

Likes

avatar avatar avatar avatar avatar avatar avatar avatar avatar avatar avatar avatar avatar avatar avatar avatar

+4 more likes

Related users ' posts
gidien
2 months ago
Cram13 Bonjour, qu'elles sont les valeurs des variables ? Avec mes remerciements Marc
gidien This indicator will not return any value. You can change the last line to : return ao...
gidien SMA1 = MovingAverage Length applied to the source candles (high , low, op...
Bateson
4 months ago
Nicolas Simple strategy with this indicator is available here: https://www.prorealcode.com/topic/ut-...
FXtonio Nicolas.... MERCI 1 millions de fois, cet indicateur gagne dans 75% des cas en scalping m1 ...
davy42 bonjour, à quel moment apparait le fleche, à l'ouverture ou la fermeture de la bougie? merci
BriceE Bonjour Nicolas, Je suis a la recherche d'indicateurs pour me donner la meilleure indicatio...
IV Mcm Good job !
IV Mcm Vous devez faire un clic droit sur le prix > propriété > ajouter indicateur Si vous...
punch1 Fonctionne pas chez moi il s'affiche rien pourtant j'ai bien fait le clic droit sur le prix ...
punch1 Je peux te faire un screen d'ecran si tu as un email :)
Fabian Hi Thomas, thanks for your explanations. Which indicator do you use in the screenshot ...
Thomas Thats On Balance Volume and Bollinger or SMA or what you want. It shows me the volume flow. ...
bertrandpinoy @MAKSIDE I would be grateful if you send me your version. have a nice day
imran Hi I have been trying to test a strategy to buy and sell based on the indicator cross overs...
Zigo I'am sorry that I answer so late, but the code seems to be working perfect. I use the indica...
oliverkeim Hi, also here not working. Only white lines.
killerplatuze Dont work anymore with the current version?
KryptoKat tolle Arbeit, professionell
Maik2404 wie kann ich den Code bekommen Paul?
jens_kittner Works with US Crude at 1h as well!
Jean-Claude REGIS Je préconise de regarder les graphiques H1 et M15 pour visualiser la tendance de fond et d'...
Nicolas I added the new ITF file in this page too (heikin ashi smoothed with colors)
ALE Thanks Nicolas!
cv Thank you very much Nicolas and Ale,
Domenec Hola Nicolas todo y el suavizado es como el awesome da ala señal 3 velas atrasada a veces de...
Lednora Bonjour à tous, Merci pour ce superbe indicateur! Est-il possible de rajouter une alerte su...
Arnaud HALVICK Hello! Very nice screener. Thank you! I am using it to scan stocks (weekly). It is very good.
odin you welcome. i would be glad when the screener is nice for you
HeikinAshi what do you think about using the screener in smaller time units (H1, M30) on indexes? And w...
mcha Bonjour Nicolas J'ai mis cet indicateur sur une période graphique 1 heure. J'ai choisi 1...
marzibre Bonjour Nicolas. I work mainly on Daily timeframe. I was looking something similar but usi...
TraderGlyn This is an excellent indicator, it provides a hugely useful visual interpretation that filte...
Nicolas Formule de l'indicateur Momentum: Le Momentum se calcule avec une simple soustraction pour ...
Roberto1 Hi, can this code be converted for the Nanotrader Platform or for the MT4 Platform?
Nicolas This website is dedicated for PRT programming, but you can still ask for private coding with...
rafadonl2 is not taken into account in the procedure. It considers only if it is a doji or when candle...
Guibourse Okay thanks, just a question : how do you plot your two lines in the same window as price ? ...
rafadonl2 sorry, I don't understand your question. Indicator draws Heikin Ashi candle, not price cand...

Top