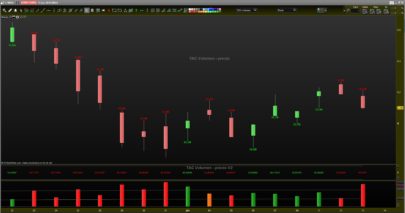
Finite Volume Element (FVE)

Finite Volume Element (FVE)

FVE is a money flow indicator but with two important differences from existing money flow indicators:

It resolves contradictions between intraday money flow indicators (such as Chaikin’s money flow) and interday money flow indicators (like On Balance Volume) by taking into account both intra- and interday price action.
Unlike other money flow indicators which add or subtract all volume even if the security closed just 1 cent higher than the previous close, FVE uses a volatility threshold to take into account minimal price changes.
The FVE provides 3 types of signals:

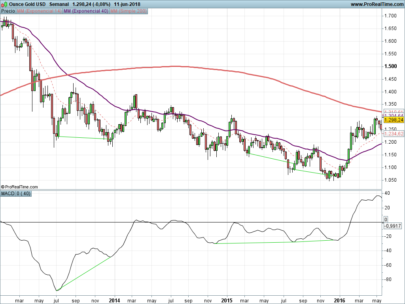
The strongest signal is divergence between price and the indicator. Divergence can provide leading signals of breakouts or warnings of impending corrections. The classic method for detecting divergence is for FVE to make lower highs while price makes higher highs (negative divergence). An alternative method is to draw the linear regression line on both charts, and compare the slopes. A logical buy signal would be for FVE, diverging from price, to rise sharply and make a series higher highs and/or higher lows.
The most obvious and coincident signal is the slope of the FVE line. An upward slope indicates that the bulls are in control and the opposite for downward.
This is a unique and very important property of this indicator. Values above zero are bullish and indicate accumulation while values below zero indicate distribution. FVE crossing the zero line indicates that the short to intermediate balance of power is changing from the bulls to the bears or vice versa. The best scenario is when a stock is in the process of building a base, and FVE diverges from price and rises to cross the zero line from below, at a sharp angle. Conversely the crossing of the zero line from above is a bearish signal to liquidate positions or initiate a short trade.

Parameters

FVE period (p = 22)

Share this

Risk disclosure:

No information on this site is investment advice or a solicitation to buy or sell any financial instrument. Past performance is not indicative of future results. Trading may expose you to risk of loss greater than your deposits and is only suitable for experienced investors who have sufficient financial means to bear such risk.

ProRealTime ITF files and other attachments : How to import ITF files into ProRealTime platform?

PRC is also on YouTube, subscribe to our channel for exclusive content and tutorials

avatar
Register or

Likes

avatar avatar avatar avatar
Related users ' posts
Geronima Ortiz okay bien estaré pendiente en esta pagina gracias
Domenec Aqui dejo colgado link del video para ver como funciona el indicador https://www.youtube....
Geronima Ortiz Gracias Domenec
Juanjo Hola?. Exactamente cuál es su utilización?.
bolsatrilera Hola Juanjo, su principio esparecido a las bandas de Bollinguer.Las lineas de las bandas son...
Gordon101 Hi when I added your Guppy indicator to my chart it went below the chart beside the oscilla...
Nicolas Add it on the price by using the wrench located on the left upper side of your price chart.
Gordon101 Thanks Nicolas, worked a treat.
Geronima Ortiz I watched the video three times, but I can not put the npips parameter as a variable. I do...
Geronima Ortiz I think the video is for an old version of prorealtime, the images do not correspond at all ...
Nicolas indicator1 = CALL “PRC_StopReversal”[npips, 1] and define npips in the optimization window ...
Etienne Hi, thanks for proving this code. I would like to contribute by adding a computation speed...
Etienne //Compute Super Smoother coefficients once if barindex = 1 then a1 = exp( -1.414 * 3.14159...
Nicolas Thanks a lot!
Rafa And the PriceMAPeriod? aren´t the same?
Nicolas The PriceMAPeriod is the period to make the average of all the last X medianprice found.
Rafa Thanks a lot Nicolás. Have a nice day
bolsatrilera
7 years ago
Kairi Relative Index
0
Indicators
GraHal Wow! Thank you Vonasi, great idea!
Vonasi No Problem GraHal. Please share anything interesting that you find using it.
Vonasi I've made a small improvement by adding a Buy and Hold line for comparison. This line can be...
anametsinwha Is it possible to change it to highs and lows rather than open and close?
Caribeengeek Bonjour j’avais vu que vous proposiez d’écrire des codes pour ceux qui s’y connaisse pas Mai...
Caribeengeek Les devises unité
Nicolas Merci d'utiliser le forum pour les demandes de programmation personnalisée
juanj
7 years ago
Vonasi Thanks for your thanks Real Pro and yes everyone should import the itf file to make sure tha...
Pepsmile Good job, which could be applied for a spectrum of another indicators.
Pepsmile As to better understand which parameters are better for an indicators in a specific period (...
Bard I was talking to a Machine Learning coder today who's algos have apparently managed to get 7...
Carlos Garcia If price tags the lower BBand, look for IIIX has positive values to enter a trade. Converse...
Nicolas Please add a request on forums for any MT4 code conversion, thank you. Follow these easy ste...
mecon I will do so, thank you!
avatar
Anonymous @mecon, did you ever get one?
ullle73 nicolas, can you somehome make this to be in the background of the price chart?
jonpt88 none did that yet right?
Nicolas You can ask for a code modification on forums, please open a new topic with your request.
Thally Thanks for the quick response Nicholas. Would you have any idea how to resolve. Manually ref...
Thally Do you think adjusting the below code might help? newperiod = minuteminute[1] if newperi...
Nicolas There is no "second" instruction.

Top