Finite Volume Element (FVE)

Finite Volume Element (FVE)

FVE is a money flow indicator but with two important differences from existing money flow indicators:

It resolves contradictions between intraday money flow indicators (such as Chaikin’s money flow) and interday money flow indicators (like On Balance Volume) by taking into account both intra- and interday price action.
Unlike other money flow indicators which add or subtract all volume even if the security closed just 1 cent higher than the previous close, FVE uses a volatility threshold to take into account minimal price changes.
The FVE provides 3 types of signals:

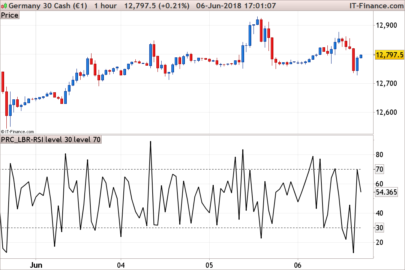
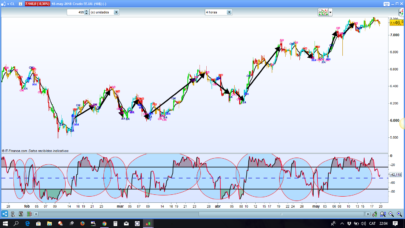
The strongest signal is divergence between price and the indicator. Divergence can provide leading signals of breakouts or warnings of impending corrections. The classic method for detecting divergence is for FVE to make lower highs while price makes higher highs (negative divergence). An alternative method is to draw the linear regression line on both charts, and compare the slopes. A logical buy signal would be for FVE, diverging from price, to rise sharply and make a series higher highs and/or higher lows.
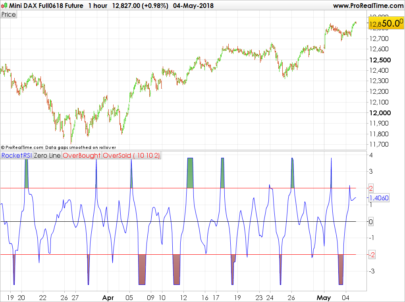
The most obvious and coincident signal is the slope of the FVE line. An upward slope indicates that the bulls are in control and the opposite for downward.
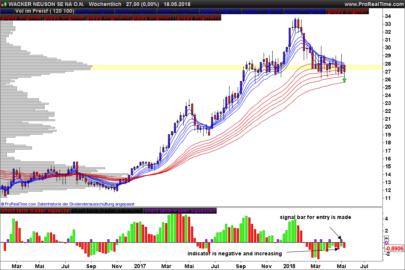
This is a unique and very important property of this indicator. Values above zero are bullish and indicate accumulation while values below zero indicate distribution. FVE crossing the zero line indicates that the short to intermediate balance of power is changing from the bulls to the bears or vice versa. The best scenario is when a stock is in the process of building a base, and FVE diverges from price and rises to cross the zero line from below, at a sharp angle. Conversely the crossing of the zero line from above is a bearish signal to liquidate positions or initiate a short trade.

Parameters

FVE period (p = 22)

Share this

Risk disclosure:

No information on this site is investment advice or a solicitation to buy or sell any financial instrument. Past performance is not indicative of future results. Trading may expose you to risk of loss greater than your deposits and is only suitable for experienced investors who have sufficient financial means to bear such risk.

ProRealTime ITF files and other attachments : How to import ITF files into ProRealTime platform?

PRC is also on YouTube, subscribe to our channel for exclusive content and tutorials

avatar
Register or

Likes

avatar avatar avatar avatar
Related users ' posts
Nicolas
8 years ago
enricot Scusa nn riesco.
SoloContado If you smooth the signal using a "summation" function, you get a nice "crossing of 0" graph....
ShaunG Greatly appreciated Nicolas!
Gianluca ok i fixed it i hope is ok like this: //TAC trader zone 10.2 | indicator //01.01.2018 //R...
TAC Bolsa Hello try this new version or view the blog with the new indicators .. https://www.t...
TAC Bolsa Sorry, TAC Trader Zone V2 https://www.tiburonesdealetacorta.com/2018/11/indicador-tac-tr...
AGTrader Interesante, muy visual Doc. Felicidades!!!
Andraxx simplemente impresionante Dom...te sigo en youtube. Me ha gustado tu canal. Gracias por comp...
TACBOLSA
8 years ago
luxrun Thank you so much Tac BOLSA, I can not post the picture tonight I'll try tomorrow. I loaded ...
TAC Bolsa A new version of TAC Volume HPI DIV10.4 is available. that marks the divergence In the fo...
Raymundo Buenas tardes. Como puedo descargar algunos indicadores de esta pagina ?
Ravindra Khanna copied it to pro real time not working. what to do?
rama I want to use this indicator in trading system, it says zig zag is obsolete and not supported
Nicolas Right, due to its repainting behavior, the zigzag is not allowed in automated trading with r...
rama I noticed it changes as time progress, I am 7 as the average, how many period it wont chang...
mangiaragni Buongiorno io non riesco a visualizzare nessun tipo di volume , mi torna sempre una linea dr...
Nicolas Assicurati che lo strumento che stai guardando abbia dei volumi! È il caso?
Nicolas Add it on price using the wrench on the left upper side of the price chart.
Stenozar thanks Nicolas, I' ll try again!
Radetzky Buongiono e grazie : l'immagine sopra ritrae l'indicatore sul TF 15 min ma a me funzio...
Steven Hi im looking for some help to put a automated code together BUY ORDER If EMA 10/25 is...
Dwell Thank you! Great tool!
ftrader8637 Any possibility to have this for multicharts. Sorry I am not a programer :-(
Nicolas Hi, we do not offer free assistance for other trading platform than ProRealTime. There is no...
MauroPro It is possible to apply this indicator ON the chart , because when I try to apply the formul...
Nicolas Yes, just apply it on the price chart by using the wrench on the left upper side of your pri...
MauroPro Hi Nicolas, thanks for the reply, I managed to apply the indicator on the chart.
Geronima Ortiz okay bien estaré pendiente en esta pagina gracias
Domenec Aqui dejo colgado link del video para ver como funciona el indicador https://www.youtube....
Geronima Ortiz Gracias Domenec
Juanjo Hola?. Exactamente cuál es su utilización?.
bolsatrilera Hola Juanjo, su principio esparecido a las bandas de Bollinguer.Las lineas de las bandas son...
Gordon101 Hi when I added your Guppy indicator to my chart it went below the chart beside the oscilla...
Nicolas Add it on the price by using the wrench located on the left upper side of your price chart.
Gordon101 Thanks Nicolas, worked a treat.
Geronima Ortiz I watched the video three times, but I can not put the npips parameter as a variable. I do...
Geronima Ortiz I think the video is for an old version of prorealtime, the images do not correspond at all ...
Nicolas indicator1 = CALL “PRC_StopReversal”[npips, 1] and define npips in the optimization window ...
Etienne Hi, thanks for proving this code. I would like to contribute by adding a computation speed...
Etienne //Compute Super Smoother coefficients once if barindex = 1 then a1 = exp( -1.414 * 3.14159...
Nicolas Thanks a lot!

Top