Finite Volume Element (FVE)

Finite Volume Element (FVE)

FVE is a money flow indicator but with two important differences from existing money flow indicators:

It resolves contradictions between intraday money flow indicators (such as Chaikin’s money flow) and interday money flow indicators (like On Balance Volume) by taking into account both intra- and interday price action.
Unlike other money flow indicators which add or subtract all volume even if the security closed just 1 cent higher than the previous close, FVE uses a volatility threshold to take into account minimal price changes.
The FVE provides 3 types of signals:

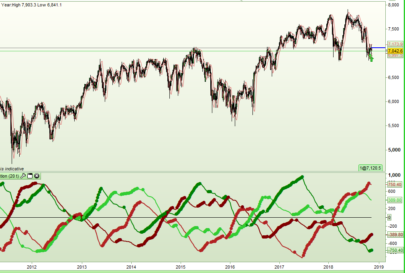
The strongest signal is divergence between price and the indicator. Divergence can provide leading signals of breakouts or warnings of impending corrections. The classic method for detecting divergence is for FVE to make lower highs while price makes higher highs (negative divergence). An alternative method is to draw the linear regression line on both charts, and compare the slopes. A logical buy signal would be for FVE, diverging from price, to rise sharply and make a series higher highs and/or higher lows.
The most obvious and coincident signal is the slope of the FVE line. An upward slope indicates that the bulls are in control and the opposite for downward.
This is a unique and very important property of this indicator. Values above zero are bullish and indicate accumulation while values below zero indicate distribution. FVE crossing the zero line indicates that the short to intermediate balance of power is changing from the bulls to the bears or vice versa. The best scenario is when a stock is in the process of building a base, and FVE diverges from price and rises to cross the zero line from below, at a sharp angle. Conversely the crossing of the zero line from above is a bearish signal to liquidate positions or initiate a short trade.

Parameters

FVE period (p = 22)

Share this

Risk disclosure:

No information on this site is investment advice or a solicitation to buy or sell any financial instrument. Past performance is not indicative of future results. Trading may expose you to risk of loss greater than your deposits and is only suitable for experienced investors who have sufficient financial means to bear such risk.

ProRealTime ITF files and other attachments : How to import ITF files into ProRealTime platform?

PRC is also on YouTube, subscribe to our channel for exclusive content and tutorials

avatar
Register or

Likes

avatar avatar avatar avatar
Related users ' posts
Doddge Bonjour Nicolas, savez-vous s'il existe un indicateur pour Prorealtime similaire au ST-TL fi...
Nicolas Pour les demandes de conversion de code, et si vous possédez le code source de l'indicateur ...
Doddge Merci beaucoup Nicolas, j'ai utilisé le formulaire avec les informations que j'ai sur cet in...
DanT01 Hi Nicolas, great work! Is it possible to contact you to help with a couple of indicators? T...
Nicolas Assistance is free on forums. For private job, you can contact me with the trading programmi...
avatar
Anonymous Thank you! I was reading the book Beyond Technical Analysis and wanted to try to coding RAV...
Nicolas
7 years ago
skysoldier hello, thank you for this code, I was wondering if it is compatible with thinkorswim at all?
Nicolas No, but you can ask for private coding job at our programming services.
nicodelhay Bonjour Nicolas Merci pour votre indicateur. Avez-vous codé les autres indicateurs publiés...
nicodelhay Je viens de retrouver un post très intéressant de laurenzo mentionant ces indicateurs : htt...
Nicolas En effet, je pense qu'ils sont présents dans cet indicateur de notre bibliothèque de codes p...
abd78 @Vonasi I saw that you did some work on seasonality, I wondered if you wanted to go here and...
Vonasi Sorry - my understanding of Italian is zero so if I watch the video I won't understand it I'...
cfta Hi Fulvio, many thanks for sharing this clever indicator, much appreciated. As Pepsmile ment...
cfta Sorry adding the PRT to code didn't work in the above comment so I guess we will have to set...
juanj Something appears to be wrong with this formula as graphing t shows t to almost never be wit...
Kosuda76 Thanks for your reply! But I do not really understand what the opposite of them the values ​...
AdriTrade Good job Louis!! How could do this for the Williams indicator? Thank you very much.
imorandin Hi!, Nice code. I'm tryng to port it to another language, but I don't understand this part:...
eckaw Hi Nicolas, I'm using this indicator when there is confluence over 3 different timeframes (5...
Nicolas Yes it is indeed possible. Create a topic in the screener forum and explain what you need an...
KyleReed i've been using this for a few days now and it's really helped me a lot in timing the execut...
luxrun Thanks, bolsatrilera, for a very good and solid screener!
luxrun sorry... indicator!
Lily Rios Gracias por el indicador, tengo una pregunta necesito programar un screener de valores que e...
Bard Hi @Ale, I was wondering if you knew why, when I went to put the Kase Peak Oscillator into i...
ALE Hello Bard, because they are two different indicators
Bard Right, thanks Ale, I have taken your code and made a coloured Peak Osc (thanks again) but ...
Nicolas Thanks again for all your valuable posts... and well formatted code! :)
Abdelkrim Maksour hi sir is this indicator for mt4 and how i can get one .
ckat55 Thank you Nicolas, is there any way that an alert can be set for when the dot appears?
Nicolas yes, change the last line with: RETURN wrb,qh and set an alarm with the alert tool for ea...
ckat55 Thank you Nicolas, I will try it.
mmoren44 no esta el color azul (Fade //Blue), No aparece en las barras el color azul.
larouedegann changer fade coloured (0,0,255)
Nicolas Apply it on the price chart. The indicator plot just one single line. There are two in the...
jamesoc Hi Nicolas, do you happen to know if there is an indicator that can be applied to charts, to...
gustavobp Buenos dias Nicolas, al agregar tu indicador no me reconoce la variable Price ni en la linea...

Top