
I hope you find it useful, in this post, I’ll explain my proposal to enhance Fibonacci levels, share the code, and the ready indicator attached for convenience.
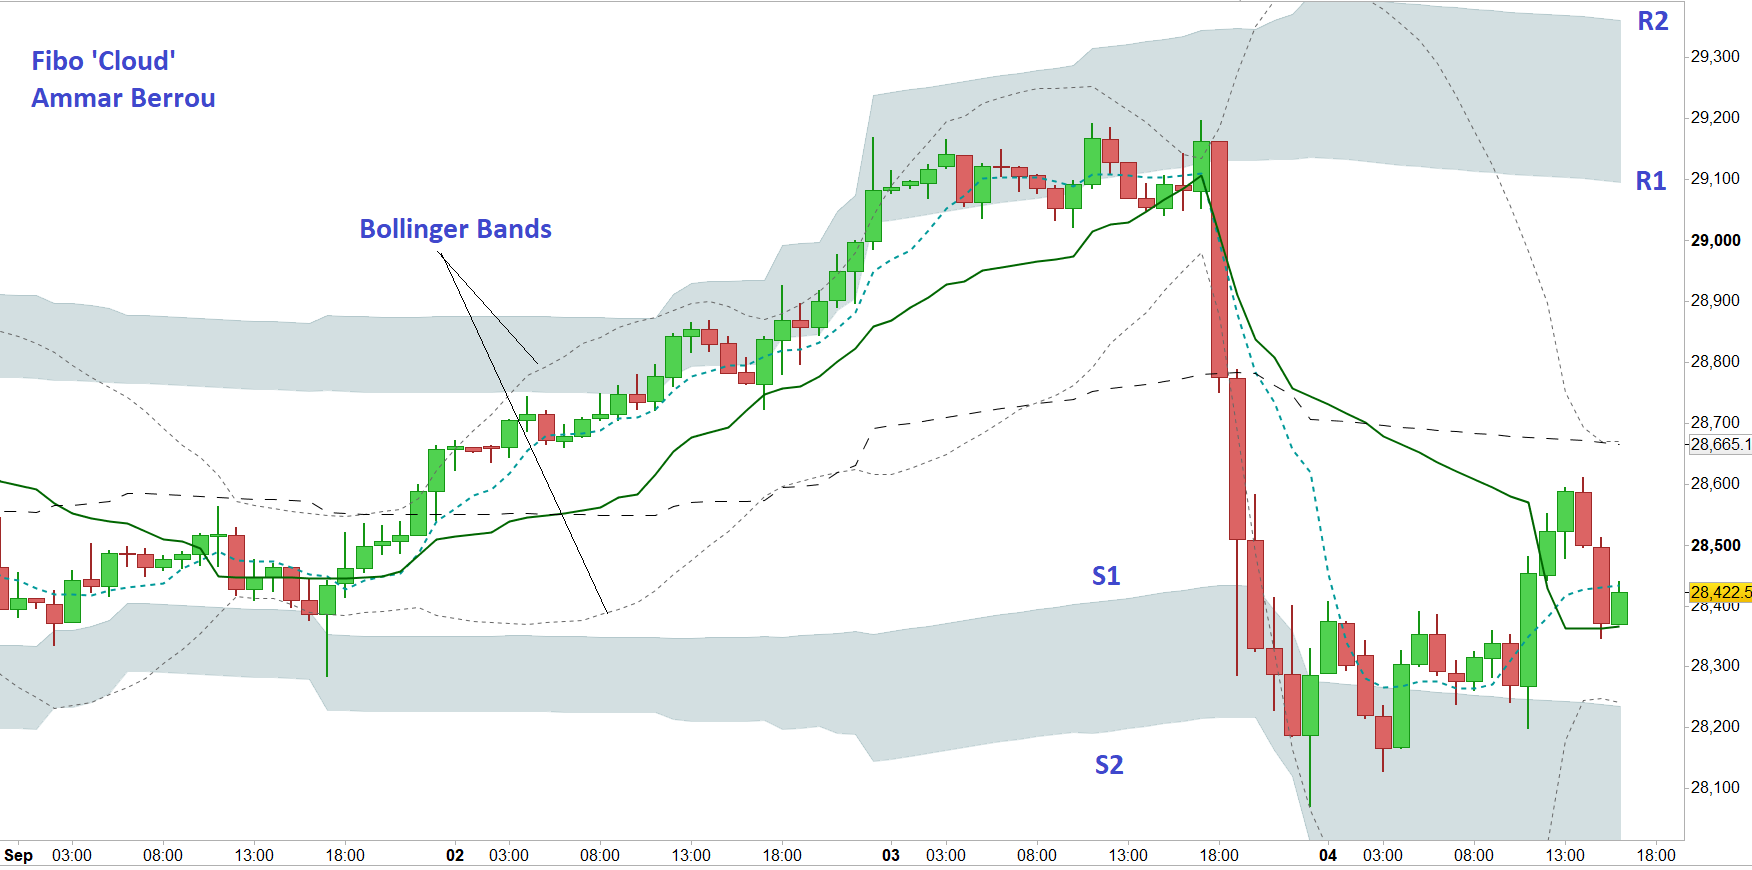
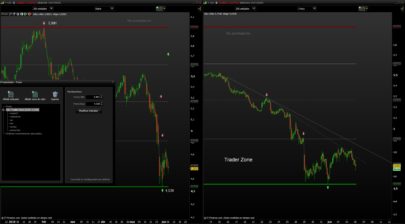
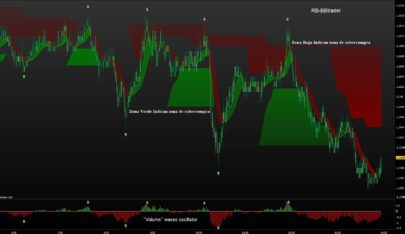
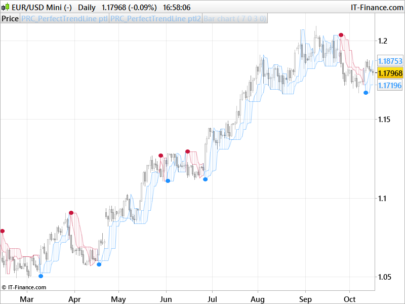
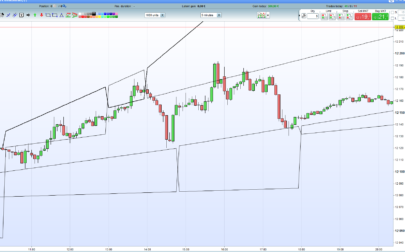
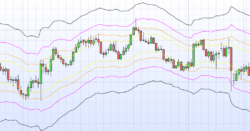
The image is DOW future Hourly chart (Fri 4th Sep), as you see the ‘Fibo Bands’ gives much better bounds to the market compared to Bollinger Bands,
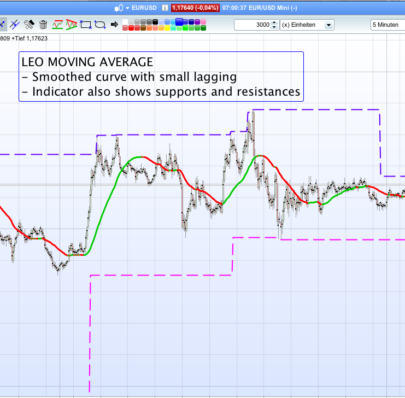
For clarity I added a grey color fill between R1/R2 and S1/S2, the lower grey zone would be the ‘ground’ and the upper is the ‘cloud’.
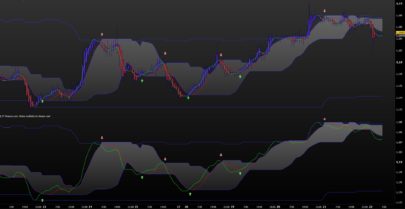
Needless to say, the longer time frames (day, week) respects those boundaries even more, but it is stronger proof of my claim to use it on hourly chart.
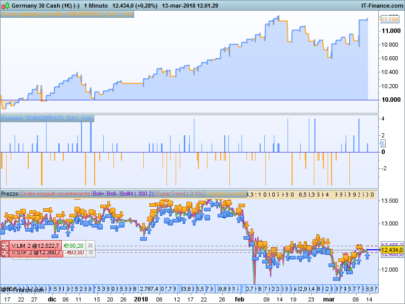
Conventionally in Fibo levels, it is calculated for last price only, here it is continuous, and visually this one is easier to comprehend.
How to trade it: whenever the price reaches one of the grey zones look for a rebound (swing) or a new trend, a higher time frame would help, as usual wait for 2nd or 3rd confirmation, volume shall confirm the signal.
here’s the pro-real-time code:
Parameters:
extreme (boolean) to calculate the range based on open/close or high/low
History (integer) how many candles to search for the range, I suggest 50
Average (integer) average period, I suggest 30 to 50
reason I made History different from Average, is to allow the indicator to see more history than the average if needed.
You need a color fill between R1 & R2, S1 & S2
I usually hide S3, R3 and dif, less is more
|
1 2 3 4 5 6 7 8 9 10 11 12 13 14 15 16 17 18 19 20 21 22 23 24 25 26 27 28 29 30 31 32 33 34 |
//created by Ammar Berrou //www.linkedin.com/in/a-berrou extreme = 1 history = 50 iaverage = 30 // --------- if extreme then hh= Highest[History](high) else hh = Highest[History](close) endif if extreme then ll=lowest[History](low) else ll=lowest[History](close) endif PP = (hh + ll + average[iAverage](close)) / 3 dif = (hh - ll) dif3 = (dif* 1.000) dif2=(dif * 0.618) dif1 = (dif * 0.382) Rr3 = PP + dif3 Rr2 = PP + dif2 Rr1 = PP + dif1 Ss1 = PP - dif1 Ss2 = PP - dif2 Ss3 = PP - dif3 return PP as "Pivot", dif as "Histogram", rr1 as "R1", rr2 as "R2",rr3 as "R3", ss1 as "S1",ss2 as "S2",ss3 as "S3" |
Share this
No information on this site is investment advice or a solicitation to buy or sell any financial instrument. Past performance is not indicative of future results. Trading may expose you to risk of loss greater than your deposits and is only suitable for experienced investors who have sufficient financial means to bear such risk.
ProRealTime ITF files and other attachments :
Find other exclusive trading pro-tools on ![]()
PRC is also on YouTube, subscribe to our channel for exclusive content and tutorials


What parameter should we change to make another channel appear in the higher or lower time unit? make the H1 channel appear on an H4 graph for example