



 ProRealCode - Trading & Coding with ProRealTime™



Hull Trend with Kahlman
November 28, 2023, 8:02 AM
Indicators
6 Comments
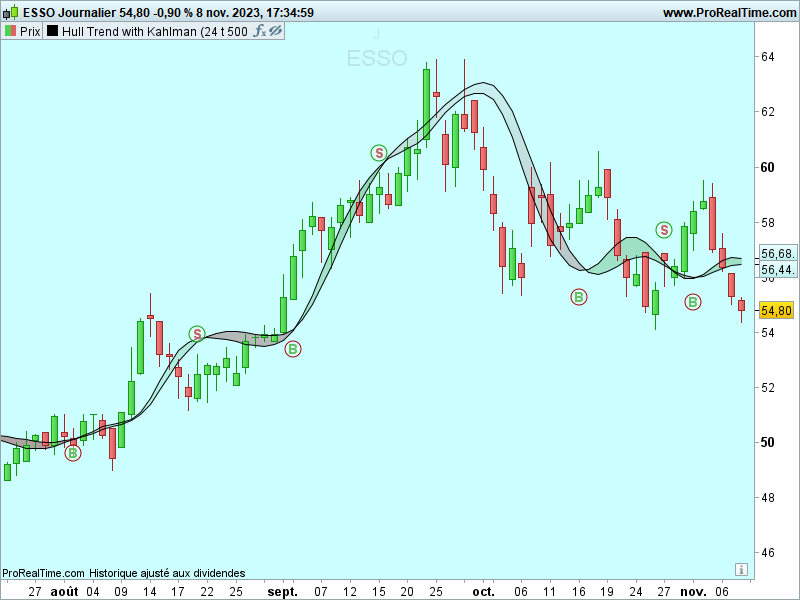
Indicator designed to implement a trading indicator combining a Hull Moving Average (HMA) with a Kahlman filter, used to identify trends and potential buy/sell signals in a financial market. Let’s break it down into simpler terms:
Overview
- Purpose: The script creates a custom trend-following indicator.
- Key Components: It uses a Hull Moving Average (HMA), a variation of the moving average designed to reduce lag and improve smoothness, and a Kalman filter, which is used to estimate the state of a system from noisy data.
How it Works
- Setting Up Variables:
length,showcross,gain,k,nonrepaintingare variables that can be adjusted to modify how the indicator behaves.srcrepresents the source data, typically the closing price of a trading instrument.
- Calculating the Hull Moving Average (HMA):
- The script calculates the HMA and a modified version, referred to as
hma3, based on the closing price (close). These calculations use weighted averages over different periods to reduce lag and increase responsiveness.
- The script calculates the HMA and a modified version, referred to as
- Kalman Filter Implementation:
- The script initializes variables for the Kalman filter:
Pred,Velo,Smooth. - The Kalman filter is applied in a loop, modifying the values of these variables to estimate the “true” state of the market price (
kf) from the noisy input data (src).
- The script initializes variables for the Kalman filter:
- Applying the Filter to the HMA:
- The script calculates two versions of the indicator: one using the raw closing price (
aandbwithout Kalman filter) and another using the Kalman-filtered price (aandbwith Kalman filter).
- The script calculates two versions of the indicator: one using the raw closing price (
- Cross Signals:
- If
showcrossis true, the script looks for crossover points betweenaandb— these are points where the two lines cross each other. - When
acrosses overb, it’s marked as a “sell” signal (S), and whenacrosses underb, it’s marked as a “buy” signal (B). - The script can optionally mark these signals on the chart using text and points, with an additional option for “non-repainting” mode, which affects how and where these signals are displayed.
- If
- Drawing on the Chart:
- The script uses drawing functions (
DRAWTEXT,DRAWPOINT) to visually represent buy and sell signals on the chart for easier interpretation.
- The script uses drawing functions (
//variables
length=24
showcross=1
nonrepainting=0


src=customclose
length =length
showcross = showcross
gain = gain
k = k

hma= WeightedAverage[ROUND(SQRT(length))](2 * WeightedAverage[ROUND(length / 2)](src) - WeightedAverage[length](src))
// Calcul des composants de l'indicateur HMA3
p=(length/2)
wma1 = WeightedAverage[round(p/3)](close)
wma2 = WeightedAverage[round(p/2)](close)
wma3 = WeightedAverage[round(p)](close)
// Calcul de l'indicateur HMA3
ga=3*wma1-wma2-wma3
hma3 = WeightedAverage[round(p)](ga)
// Initialisation des variables du filtre de Kalman
ONCE Pred = src
ONCE Velo = 0
ONCE Smooth = src
kf = src
// Boucle de calcul pour le filtre de Kalman
IF BarIndex > 0 THEN
Smooth = Pred + (src-Pred)*SQRT((gain/10000)*2)
Velo=Velo+((gain/10000)*(src-Pred))
Pred=Smooth+Velo
kf=Pred
ENDIF
wma1f = WeightedAverage[round(p/3)](kf)
wma2f = WeightedAverage[round(p/2)](kf)
wma3f = WeightedAverage[round(p)](kf)
// Calcul du filtrage de b
gaf=3*wma1f-wma2f-wma3f
if k then
a =WeightedAverage[ROUND(SQRT(length))](2 * WeightedAverage[ROUND(length / 2)](kf) - WeightedAverage[length](kf))
b =WeightedAverage[round(p)](gaf)
endif
if not k then
a = hma
b = hma3
endif
if showcross then
crossdn =a crosses over b
atrh = averagetruerange[10](close)*0.5
if nonrepainting=0 then
if crossdn then
DRAWTEXT("S", barindex-1,high[1]+atrh,dialog,bold,14)coloured(155,0,0)
DRAWPOINT(barindex-1,high[1]+atrh,4)coloured(255,255,255,100)bordercolor(0,155,0,250)
endif
crossup = a crosses under b
if crossup then
DRAWTEXT("B", barindex-1,b[1]-atrh,dialog,bold,14)coloured(0,155,0)
DRAWPOINT(barindex-1,b[1]-atrh,4)coloured(255,255,255,100)bordercolor(155,0,0,250)
endif
endif
if nonrepainting=1 then
if crossdn then
DRAWTEXT("S", barindex,high+atrh,dialog,bold,14)coloured(155,0,0)
DRAWPOINT(barindex,high+atrh,4)coloured(255,255,255,100)bordercolor(0,155,0,250)
endif
crossup = a crosses under b
if crossup then
DRAWTEXT("B", barindex,b-atrh,dialog,bold,14)coloured(0,155,0)
DRAWPOINT(barindex,b-atrh,4)coloured(255,255,255,100)bordercolor(155,0,0,250)
endif
endif
endif
return a as "hull",b as "hull3"
Download
Filename:
Hull-Trend-with-Kahlman-1.itf
Downloads:
157
Veteran
I usually let my code do the talking, which explains why my bio is as empty as a newly created file. Bio to be initialized...
Author’s Profile
Loading...