This indicator was originally developed by John F. Ehlers (Stocks & Commodities , V.33:10 (September, 2015): “Decyclers”).
Mr. Ehlers suggested a way to improve trend identification using high-pass filters. The basic smoothers like SMA , low-pass filters, have considerable lag in their display. Mr. Ehlers applied the high-pass filter and subtracted the high-pass filter output from the time series input. Doing these steps he removed high-frequency short-wavelength components (the ones causing the wiggles) from the time series.
As a result he got a special series of the low-frequency components with virtually no lag – the Decycler.
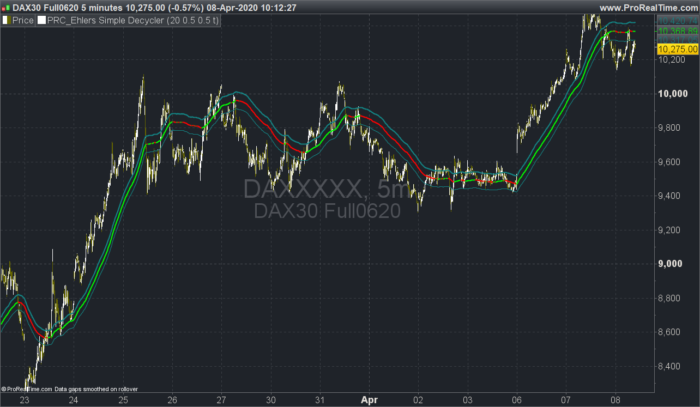
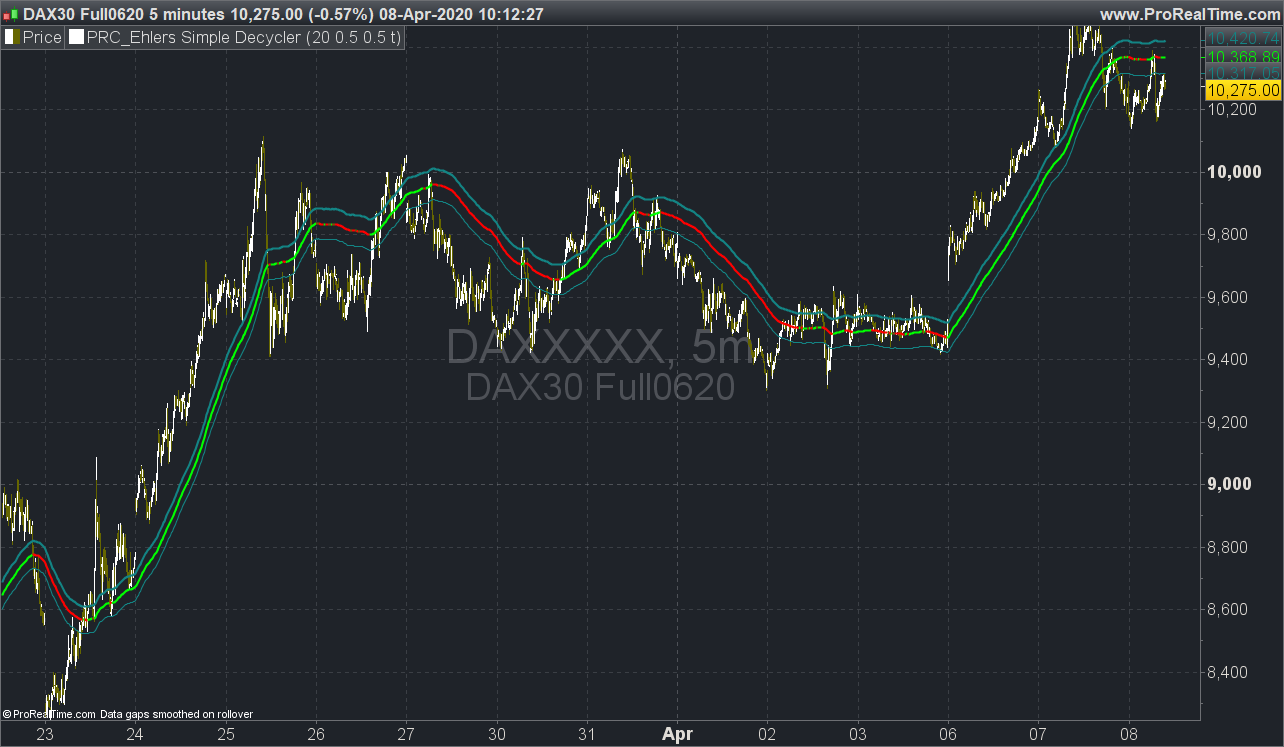
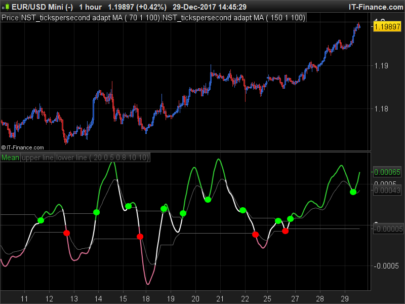
The Decycler is plotted with two additional lines (the percent-shifts of Decycler) and together they form a hysteresis band.
If the prices are above the upper hysteresis line, then the market is in an uptrend. If the prices are below the low hysteresis line, then the market is in a downtrend. Prices within the hysteresis band are trend-neutral.
(description found on the web, indicator converted from Pinescript language following multiple requests on the forums).
|
1 2 3 4 5 6 7 8 9 10 11 12 13 14 15 16 17 18 19 20 21 22 23 24 25 26 27 28 29 30 31 32 33 34 35 36 37 38 39 40 41 42 43 44 45 46 47 48 |
//PRC_Ehlers Simple Decycler | indicator //08.04.2020 //Nicolas @ www.prorealcode.com //Sharing ProRealTime knowledge // --- settings highpassLength = 20 upperPercent = 0.5 //Upper Band % Shift lowerPercent = 0.5 //Lower Band % Shift highlightMovements = 1 //Highlight Decycler Movements ? 0=false ; 1=true // --- end of settings src = close once PI = 3.14159265359 if barindex>highpassLength then // High-pass Filter alphaArg = 2 * PI / (highpassLength * sqrt(2)) alpha = 0.0 if cos(alphaArg) <> 0 then alpha = (cos(alphaArg) + sin(alphaArg) - 1) / cos(alphaArg) else alpha = alpha[1] endif hp = 0.0 hp = square(1 - (alpha / 2)) * (src - 2 * src[1] + src[2]) + 2 * (1 - alpha) * hp[1] - square(1 - alpha) * hp[2] decycler = src - hp if highlightMovements then if decycler >= decycler[1] then r=0 g=255 else r=255 g=0 endif endif upperBand = (1 + upperPercent / 100) * decycler lowerBand = (1 - lowerPercent / 100) * decycler endif return decycler coloured(r,g,0) style(line,2) as "Decycler", upperband coloured(19,132,132) as "upper band", lowerband coloured(19,132,132) as "lower band" |
Share this
No information on this site is investment advice or a solicitation to buy or sell any financial instrument. Past performance is not indicative of future results. Trading may expose you to risk of loss greater than your deposits and is only suitable for experienced investors who have sufficient financial means to bear such risk.
ProRealTime ITF files and other attachments :
Find other exclusive trading pro-tools on ![]()
PRC is also on YouTube, subscribe to our channel for exclusive content and tutorials


Thanks !
I tried to apply the indicator on a daily and weekly chart, but there’s something wrong. Probably I made an error. The indicator does not “follow” the chart. It’s plotted above or under the chart (it depends on the stock you plot). I used the itf file. Have you got any suggestion. The indicator seems very useful.
Try to adapt the “highpassLength”
Thank you very much, on a daily / weekly chart it works with highpass lenght near 3-4.
Ehlers Simple Decycler, bjr nicolas, je trouve cet indicateur assez démentiel, ?…. prometteur pour une stratégie avec levier à mettre en place … , pensez vous que celà en vaut la peine ? et si ou sur quelle indicateur etf ou cfd d’après vous ? en daily ? merci YJ
Cheers, a great addition Nicolas!
hi, i have past the code and the indicator is not in the graphique. he’s down like RSI
Apply it on the price in the price settings window
Thanks!
I cant make it work in anyway.
Play with the “highpassLength” settings and add more units displayed on your chart.
Interesting indicator! Can anyone get it working for longer “highpasslengths”? I’ve been testing lengths of 80-100 on a 1 min chart, but the result just looks strange…
Hello Nicolas,
Really thank you for your work.
I am trying to use this indicator on a 1 minute price time frame chart, but the indicator should be calculated on a 1 hour time frame.
When I use the TIMEFRAME(1 hour, Updateonclose) on the 1 minute price chart I never arrive to the same values as in a 1 hour price chart.
I work on the DAX IG future.
I have extensively tested the issue and it starts to deviate at the market opening (01:00 and 02:00).
If I try to remove those hours from the calculation, it does not work.
Do you have a suggestion where is the problem ?
Thanks in advance.
You can try it by adding the TIMEFRAME (1 hour, Updateonclose) on the code and test it on a 1 minute and 1 hour chart.
Due to the different barindex measurement, you have to use a 80.000 minute chart vs a 10.000 hour chart to get similar time span.
Check your custom trading hours and use the default market ones.
Hello Nicolas,
Thanks again for all your support.
Finally I debugged the problem.
The simple code attached at 01:59 in DAX and NQ (did not test in other indexes) gives a different value in DEMO mode IG platform.
Retested in the Premium and it works OK ???
Same date -> different values ???
Two day of testing …
Kind regards
The releases for Demo and Premium are different ?
Hi Nicolas,
Thank you very much indeed for this indicator (and all the others you are providing)!
I am using the Ehler’s Simple Decycler as well as the Ehler’s Decycler Oszillator for automatic trading.
Both work very well but share one unfavourable characteristic:
The variable HP forms an arch as an artifact at the entry of calculated values before reaching the actual price level. This artifact invalidates the indicator for the concerned periods.
(HP is being subtracted from the price value to obtain the indicator value: decycler = src – hp.)
The arc’s extend depends on the parameter value of HIGHPASSLENGTH. With larger values it becomes quite significant.
These are some period numbers at which the indicator first touches the actual price range and becomes valid that I have measured when applying different values of HIGHPASSLENGTH:
100: ~2.500
200: ~10.000
300: ~18.000
400: ~38.000
500: ~55.000
This effect does not seem to be dependent on the underlying instrument or time frame.
My personal workaround is to not go into the marked based on the indicator before it has crossed over the instrument’s price, say, two or three times. However, trading is delayed using this method.
1) Can we circumvent the initial arc formed by HP?
2) If not: Can we somehow estimate the number of periods that takes the indicator to reflect a valid value?
Thank you very much once again!
Merten