







John Ehlers Optimal Tracking Filter

Dr. R.E. Kalman introduced his concept of optimum estimation in 1960. Since that time, his technique has proven to be a powerful and practical tool. The approach is particularly well suited for optimizing the performance of modern terrestrial and space navigation systems. Many traders not directly involved in system analysis have heard about Kalman filtering and have expressed an interest in learning more about it for market applications. Although attempts have been made to provide simple, intuitive explanations, none has been completely successful. Almost without exception, descriptions have become mired in the jargon and state-space notation of the “cult”.
Surprisingly, in spite of the obscure-looking mathematics (the most impenetrable of which can be found in Dr. Kalman’s original paper), Kalman filtering is a fairly direct and simple concept. In the spirit of being pragmatic, we will not deal with the full-blown matrix equations in this description and we will be less than rigorous in the application to trading. Rigorous application requires knowledge of the probability distributions of the statistics. Nonetheless we end with practically useful results. We will depart from the classical approach by working backwards from Exponential Moving Averages. In this process, we introduce a way to create a nearly zero lag moving average. From there, we will use the concept of a Tracking Index that optimizes the filter tracking for the given uncertainty in price movement and the uncertainty in our ability to measure it.
(text and code adapted from jamesgoulding.com website).
Price = (High+Low)/2

if(barindex>5) then
Value1 = .2*(Price - Price[1]) + .8*Value1[1]
Value2 = .1*(High - Low) + .8*Value2[1]
if (Value2 <>0) then
lambda = Abs(Value1 / Value2)
endif

alpha = ( -lambda*lambda + SQRT(lambda*lambda*lambda*lambda + 16*lambda*lambda)) /8
Value3 = alpha*Price + (1-alpha)*Value3[1]
endif

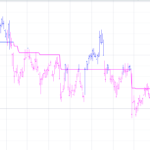
RETURN Value3 as "Tracking filter"
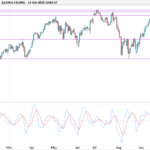
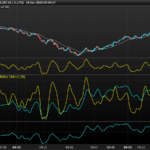
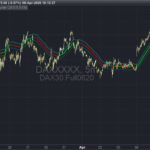
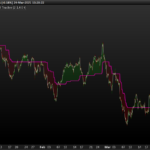
Comments
You must be logged in to post a comment.

Vous ne pouvez pas, car ProBuilder ne prend actuellement pas en charge MTF (Multiple Time Frames). Selon les rumeurs, PRT y travaille et il devrait être disponible en 2020, espérons-le.


Bonjour à tous,
Pour ceux qui veulent adoucir ce filtre on peut lui adjoindre une moyenne mobile
// Filtre Optimal track J Ehlers
// John Ehlers Optimal Tracking Filter

Price = (High+Low)/2
if(barindex>5) then
Value1 = .2*(Price - Price[1]) + .8*Value1[1]
Value2 = .1*(High - Low) + .8*Value2[1]
if (Value2 <>0) then
lambda = Abs(Value1 / Value2)
endif
alpha = ( -lambda*lambda + SQRT(lambda*lambda*lambda*lambda + 16*lambda*lambda)) /8
Value3 = alpha*Price + (1-alpha)*Value3[1]

endif
cc = customclose

ma = average [p,m](value3)

RETURN cc as " cc " , Value3 as "Tracking filter" , ma as " ma "

// Variables :
// p = 8 periode
// m = ma type = triangulaire

Merci pour ce travail En quoi cette MM est elle différente d’une MM courte ?