Dynamic Zone Elasticity

Dynamic Zone Elasticity

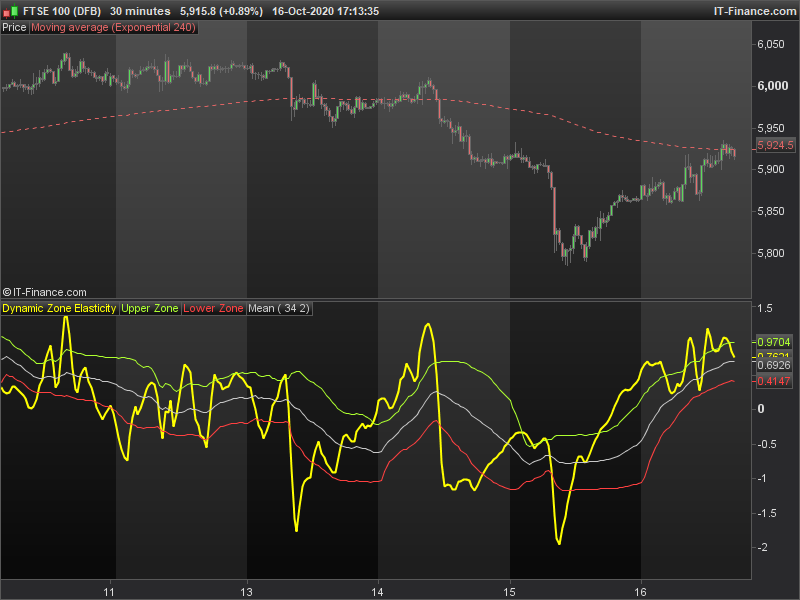
Dynamic Zone Elasticity indicator is an oscillator to predict short term direction. It is best used for scalping or automated trading. It comprises a signal line and dynamic lower and upper zones, as well as a mid-level.

Screenshots:

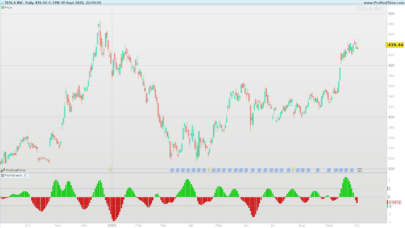
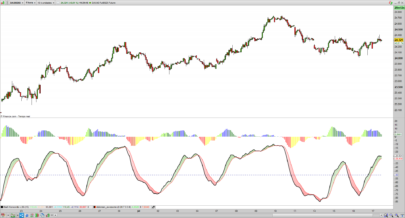
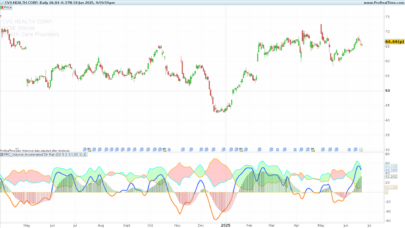
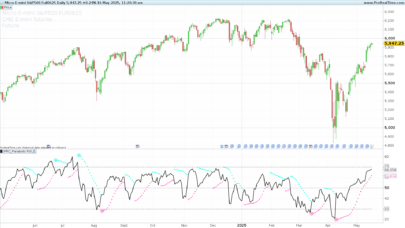
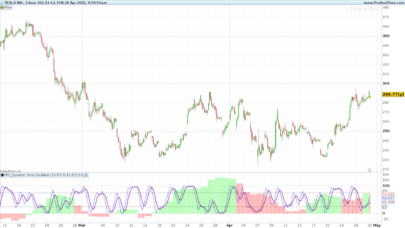
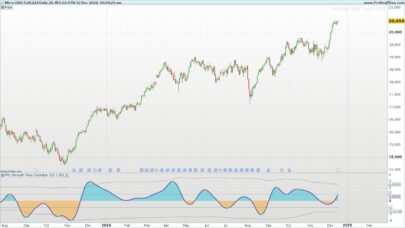
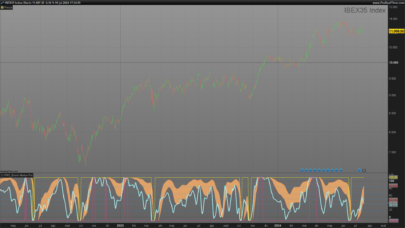
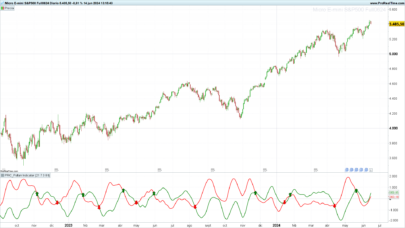
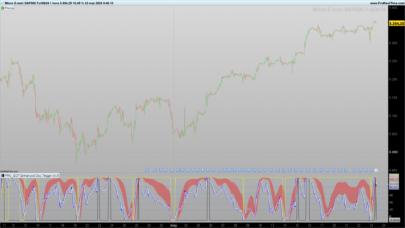
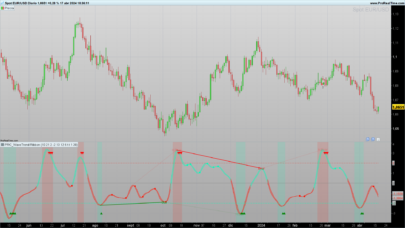
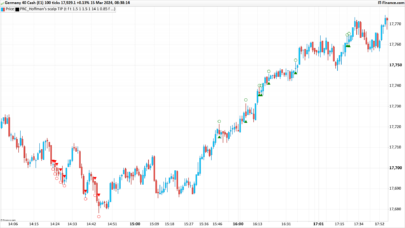
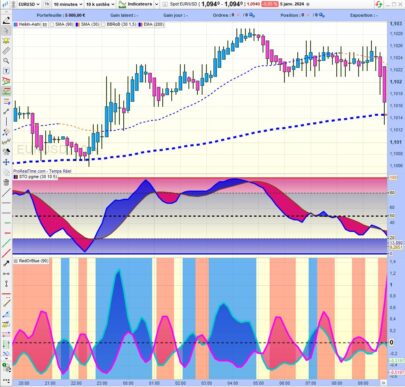
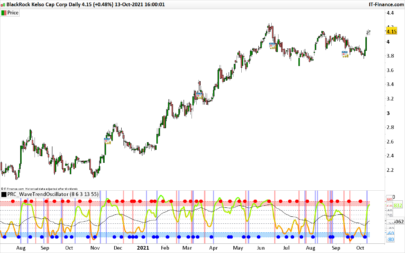
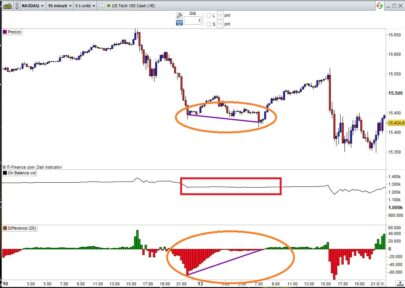
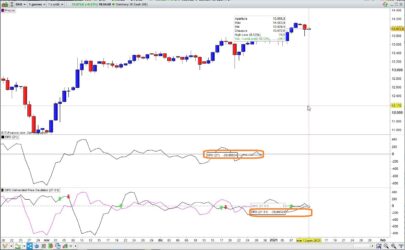
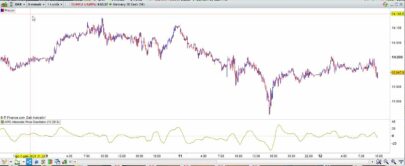
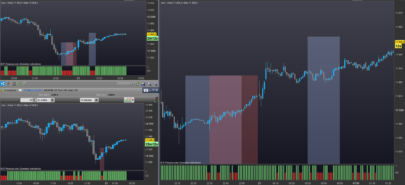
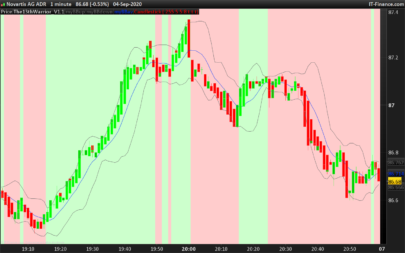
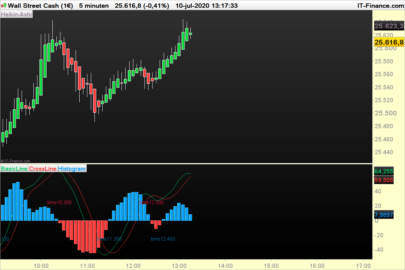
There are three screen shots attached with this indicator: Two are showing very different indicator settings on different markets, and a third screen shot shows an indicator test. The indicator test is not a trading strategy – it is simply a back-test placing a long and short at every (typical) buy and sell signal, being in the market 100% of the time. An indicator an be considered potentially useful if taking every signal generates a better return than the underlying market.

Parameters:

  • Period – the number of candles to look back on, this adjusts the “speed” of the indicator.
  • Smoothing – Reduces signal noise, adding delay

Interpretation:

Short term trading signals are generated when the signal line crosses through the various zone lines. A rising signal-line implies an upward continuation in price whilst a falling signal-line implies a downward continuation.

Typical interpretation would be as follows: A buy-signal may be generated as the signal line crosses above the lower zone, with a sell-signal generated as the signal line crosses below the upper zone. There are no strict rules dictating which zone crosses generate a signal – the user should derive their own conclusion based on the chosen market and indicator parameters.

The indicator can be used with a wide range of values to give different types of signals.  Further filters can be derived by taking note of the hemisphere (position from zero) and direction of the zone lines, with respect to the signal line.

Credits
Author:  Maz @ PRC
Release date: 16th October 2020
Inspiration: This study is inspired by “Elasticity of price” indicator, as first published by Nicolas of PRC, here: https://www.prorealcode.com/prorealtime-indicators/elasticity-of-price/
Thank you Nicolas for the original version.

Further research

Automated strategies can be derived from this study, particularly in conjunction with other indicators or filters. I hope this is helpful and welcome any discussion on subsequent strategies.


Share this

Risk disclosure:

No information on this site is investment advice or a solicitation to buy or sell any financial instrument. Past performance is not indicative of future results. Trading may expose you to risk of loss greater than your deposits and is only suitable for experienced investors who have sufficient financial means to bear such risk.

ProRealTime ITF files and other attachments : How to import ITF files into ProRealTime platform?

PRC is also on YouTube, subscribe to our channel for exclusive content and tutorials

  1. FernetTrader • 10/19/2020 #

    Im trying to use this indicator with another indicator but i cant get it to work. I want to take trades when yellow line crosses the red or green. Im trying to code it like this, very simple: result crosses over top / result crosses under btm.
    Could you just give me an example of how to code that?
    Im a new and right now im just trying out stuff for fun to learn.
    Thanks in advance and great work!

    • FernetTrader • 10/19/2020 #

      think i found a solution!

    • monochrome • 10/19/2020 #

      Can you please share how you made it work? I cant seem to make it work in a strategy

  2. monochrome • 10/19/2020 #

    Thanks for the indicator. Very interesting!

avatar
Register or

Likes

avatar avatar avatar avatar avatar avatar avatar
Related users ' posts
Iván Thanks ;)
kats BONJOUR je lai mis sur du renko , il est complexe car toujours a l'envers??? Peut être ne ...
RTR Great tool again and great job, thank you! So from what I see everytime Z-Score is over 0 m...
Fgats quelques explications en Français ici : Some explanations in French here : https://www.p...
Nicolas Merci pour cette contribution, j'apprécie ! :)
Fgats Merci Nicolas pour ces encouragements et merci aussi pour le commentaire en Anglais accompa...
atlante hi nicolas this indicator have 2 wrong borderline and islalastbarupdate. thank you can you h...
Nicolas That'"s because you are not using PRT v11? Just remove lines 59 to 62
robertogozzi An updated version can be found here https://www.prorealcode.com/topic/conversion-of-pine-sc...
jissey Bonjour Robertogozzi, cet indicateur est interessant mais serait-il possible de marquer la ...
robertogozzi Sure, but you should start a new topic on the Probuilder support forum. Thank you :)
robertogozzi I don't actually know what they are calculating. As soon as I know, I will post further info.
robertogozzi It's because they calculate future bars, that's why it's not possible to use that indicator ...
poldoposta si potrebbe trovare una soluzione per sovrapporlo al prezzo?
robertogozzi Basta che tu clicchi sull'etichetta (tag) PREZZO del grafico (appena sotto l'angolo in alto ...
Fabian Hi Thomas, thanks for your explanations. Which indicator do you use in the screenshot ...
Thomas Thats On Balance Volume and Bollinger or SMA or what you want. It shows me the volume flow. ...
bertrandpinoy @MAKSIDE I would be grateful if you send me your version. have a nice day
Zigo
4 years ago
Zex-Indicator
Zex-Indicator
6
Indicators
bertrandpinoy Hello Zigo can you turn into an automatic strategy?
eckaw Hey @Zigo thanks for this indicator. May I ask what the multiplier 1.682 is derived from? I ...
Zigo Hello, eckaw, its not so important I had meant 1.618 and not 1.682. It has nothing to do wit...
kbrooks323 Hello would someone be willing to release a scan code for this? that would be helpful as I s...
Nicolas You can do easily this screener by using the assisted creation tool. It would take you about...
kbrooks323 I just figured it out thanks!
rama what is the buy condition or sell condition for this can you suggest a code k1=1 buy and k1...
rama I would like to know at point 1 an alert or binary indicator so that I can place order
maxlys Bonjour Nicolas, merci pour ce code qui a l'air intéressant. Comment ajouter dans le code l'...
Marius Zammit Still learning and very new to all this. Can this indicator be turned into an automated trad...
Nicolas Yes sure, please create a dedicated post in the automated trading forum.
leederbyshire Hi is it possible to replace the dots with red/green vertical lines? Thank you.
darbes Hi How does it go on live ? JC
antonio73 Balmora74, io vedo che funziona anche su timeframe ad 1 minuto con piccole ottimizzazioni, t...
Juananantoniorodriguez hola buenas, a este sistema automático, Cómo se le podría poner un stoploss de beneficio sim...
cdc.andersson Hello, when trying to include this wonderful Dynamic RSI on my trading system i get the erro...
Rafyone Bonjour Nicolas et bonne année lol J'ai une erreur qui apparait concernant drawbarchart une...
Nicolas Je pense que tu n'utilises pas le bon éditeur de code, cette instruction est compatible uniq...
arnaudat Merci nicolas, j'ai déjà pris cette version et en plus je suis sur les futures. Par contre d...
ullle73 hi nicolas, when im making a strategy out of this i get the error "PRC_VWAP z-score" called ...
Nicolas Please open a new topic in the ProOrder forum section and post the code there in order to ch...
Bard Problems with Safari latest s/ware and this site and links and adding code. Let me add the...
grimweasel47 Ok thanks Nicolas - could this be adapted to take into account MFI and then have price, volu...
Nicolas I don't understand what you mean exactly, would be better to open a topic about this idea wi...
Nicolas Yes, that's how it goes when using loops..
JosephFelix Hi, Could I please have help with adding these indicators 'on price'? Every indicator that I...
Nicolas Just add it on price by clicking the wrench on the left upper side of the price chart.
Nicolas S11 variable is not a loop but a ratio calculation. In real time the codes is processed on e...
Stephan_V Nicolas, This regression delivers damn good results, especially for trends ! I'm wonde...
Nicolas Least square method is used here in order to get the perfect y = ax2 + bx + c

Top