1. Introduction
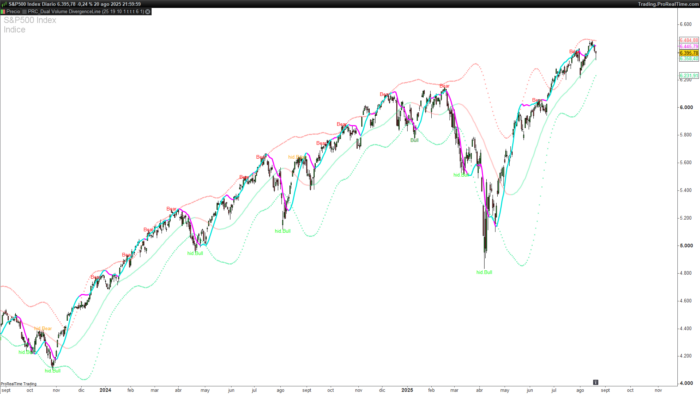
The Dual Volume Divergence Line (DVD/Line) is a sophisticated technical analysis tool designed to detect divergences between price and volume using two complementary volume indexes: the Positive Volume Index (PVI) and the Negative Volume Index (NVI). Its main goal is to provide early signals of potential trend reversals by analyzing volume behavior.
In addition to plotting a combined divergence line (DVD), the indicator also draws dynamic bands and labels bullish and bearish divergences — both regular and hidden — directly on the chart. This makes it a powerful visual aid for identifying trading opportunities.
2. Indicator Foundation
The calculation starts with a typical price, obtained as the average of the high, low, and close for each bar. Based on this input, two indices are constructed:
- PVI (Positive Volume Index): Accumulates the typical price increase when the current bar closes higher than the previous one.
- NVI (Negative Volume Index): Accumulates the typical price decrease when the current bar closes lower than the previous one.
Both indexes are smoothed using a weighted average, and their divergence from price is calculated. The difference between the PVI and NVI divergences forms the basis of the DVD Line, which reflects the directional pressure of volume.
This DVD Line is further compared to a linear regression to visually detect potential momentum shifts.
3. Calculation and Components
Customizable Parameters
zaman: Sampling period for smoothing PVI/NVI (default: 17).genislik: Width for smoothing and band projection (default: 12).takip: Length for linear regression (default: 3).carpan: Multiplier to adjust indicator sensitivity.gosterBand: Toggle band visualization.gosterNormal: Show regular divergences (on/off).gosterGizli: Show hidden divergences (on/off).Ir: Divergence detection range.Ntype: Choose raw (Dvdi) or smoothed (DVD) data for divergence detection.
Main Calculations
- PVI & NVI Divergences: Computed by subtracting their respective weighted averages from the current value.
- DVD Line (Dvdi): The difference between PVI and NVI divergences, multiplied by a factor.
- Smoothed DVD (DVD): Weighted average of
Dvdiadded to the typical price. - Regression Line (DVD2): A linear regression of the DVD, used for conditional coloring.
Dynamic Bands
Upper and lower bands are calculated using the Root Mean Square (RMS) of the highest and lowest DVD values over the smoothing window. These bands act as dynamic zones to evaluate extreme conditions and are rescaled to highlight outliers.
4. Divergence Detection
The indicator identifies two main types of divergences:
- Regular Divergences: Price makes a new high/low, but the oscillator does not confirm it.
- Hidden Divergences: Price does not make a new high/low, but the oscillator does.
Divergences are detected by locating pivot points in both price and the selected oscillator (IrGo). When a new pivot is formed, it is compared to the previous one, and if a divergence condition is met, the appropriate label is drawn:
"Bull"for regular bullish divergence."hid.Bull"for hidden bullish divergence."Bear"for regular bearish divergence."hid.Bear"for hidden bearish divergence.
All labels are offset using ATR to avoid overlapping with price bars.
5. How to Interpret the Indicator
- DVD Line: Represents volume directional strength. Rising above its regression line (DVD2) suggests bullish pressure, while falling below it indicates bearish momentum.
- Bands: Function as dynamic overbought and oversold levels. Crosses or rejections around these levels can signal potential reversals.
- Divergences: Serve as advanced warning signals, especially effective near key support or resistance zones.
The indicator works well across different timeframes, making it suitable for scalpers, intraday traders, and swing traders alike.
6. Indicator Settings
Here’s a breakdown of each adjustable parameter:
zaman(Sampling Period): Controls signal sensitivity. Lower values yield more signals but may be noisier.genislik(Band Width): Affects smoothing degree. Higher values result in smoother lines.takip(Trailing Length): Number of bars for linear regression, used for coloring the DVD Line.carpan(Multiplier): Adjusts how strongly PVI and NVI divergences influence the DVD Line.gosterBand: Enables/disables band visualization.gosterNormalandgosterGizli: Toggle the display of regular and hidden divergences.Ir: Sets the pivot detection range; higher values result in fewer but stronger signals.Ntype: Allows switching between raw (Dvdi) and smoothed (DVD) divergence sources.
It is recommended to test different configurations based on the asset and timeframe to optimize the indicator’s performance.
7. Indicator Code
|
1 2 3 4 5 6 7 8 9 10 11 12 13 14 15 16 17 18 19 20 21 22 23 24 25 26 27 28 29 30 31 32 33 34 35 36 37 38 39 40 41 42 43 44 45 46 47 48 49 50 51 52 53 54 55 56 57 58 59 60 61 62 63 64 65 66 67 68 69 70 71 72 73 74 75 76 77 78 79 80 81 82 83 84 85 86 87 88 89 90 91 92 93 94 95 96 97 98 99 100 101 102 103 104 105 106 107 108 109 110 111 112 113 114 115 116 117 118 119 120 121 122 123 124 125 126 127 128 129 130 131 132 133 134 135 136 137 138 139 140 141 142 143 144 145 146 147 148 149 150 151 152 153 154 155 156 157 158 159 160 161 162 163 164 165 166 167 168 169 170 171 172 173 174 175 176 177 178 179 180 181 |
// ------------------------------------------ // PRC_Dual Volume Divergence Line (DVD/Line) //version = 0 //08.07.25 //Translated from TW by //Iván González @ www.prorealcode.com //Sharing ProRealTime knowledge // ------------------------------------------ // --- Configuración de Parámetros // ------------------------------------------ //zaman = 17 // Dvd Sampling Period //genislik = 12 // Band Width //takip = 3 // Trailing Length //carpan = 1.0 // Multiplier //gosterBand = 0 // 'Show Bands' //gosterNormal = 1 // 'Show Normal Divergences' //gosterGizli = 1 // 'Show Hidden Divergences' //Ir = 1 // 'Divergence Range' //Ntype = 1 // Divergence Selection True=smoothed (DVD); False raw (Dvdi) // ------------------------------------------ // -- Cálculo del Indicador DVD // ------------------------------------------ // --- Origen de datos --- kaynak = (high + low + close) / 3 // --- Cálculo del Índice de Volumen Positivo (PVI) IF barindex > 0 THEN IF kaynak > kaynak[1] THEN pvi = pvi[1] + (kaynak - kaynak[1]) ELSE pvi = pvi[1] ENDIF ELSE pvi = 0 ENDIF // --- Señal y Divergencia PVI --- pviSinyal = WeightedAverage[zaman](pvi) pviIraksama = pvi - pviSinyal // --- Cálculo del Índice de Volumen Negativo (NVI) --- IF barindex > 0 THEN IF kaynak < kaynak[1] THEN nvi = nvi[1] - (kaynak - kaynak[1]) ELSE nvi = nvi[1] ENDIF ELSE nvi = 0 ENDIF // --- Señal y Divergencia NVI --- nviSinyal = WeightedAverage[zaman](nvi) nviIraksama = nvi - nviSinyal // --- Cálculo del DVD --- Dvdi = (pviIraksama - nviIraksama) * carpan Dvd = WeightedAverage[genislik](Dvdi + kaynak) Dvd2 = LinearRegression[takip](Dvd)-LinearRegressionSlope[takip](Dvd) // ta.linreg(Dvd, takip, 1) // --- Cálculo de Bandas --- MaxDVD = Highest[genislik](Dvd) MinDVD = Lowest[genislik](Dvd) // Implementación de la función RMS (Root Mean Square) rmsMax = SQRT(Average[genislik](SQUARE(MaxDVD))) rmsMin = SQRT(Average[genislik](SQUARE(MinDVD))) Ust = rmsMax Alt = rmsMin Orta = (Alt + Ust) / 2 // Proyección de las bandas Ust = 2 * Ust - Orta Alt = 2 * Alt - Orta // --- Variables para colorear las líneas --- // Línea DVD principal IF Dvd > Dvd2 THEN Rdvd = 0 Gdvd = 230 Bdvd = 222 ELSE Rdvd = 251 Gdvd = 0 Bdvd = 255 ENDIF // Línea Media IF Orta > Orta[1] THEN Rorta = 0 Gorta = 230 Borta = 119 ELSE Rorta = 282 Gorta = 82 Borta = 82 ENDIF // -----------------------------------------------------------------------------\\ // -- Detección de Divergencias // -----------------------------------------------------------------------------// // --- Selección del Oscilador para Divergencia --- IF Ntype = 1 THEN IrGo = Dvdi ELSE IrGo = Dvd ENDIF // --- Detección de Puntos Pivote (con retraso necesario en ProBuilder) --- pivotHighDetected = (IrGo[Ir] = HIGHEST[2 * Ir + 1](IrGo)) pivotLowDetected = (IrGo[Ir] = LOWEST[2 * Ir + 1](IrGo)) // --- Almacenamiento de valores de pivotes anteriores --- ONCE lastPHprice = 0 ONCE lastPLprice = 0 ONCE lastPHosc = 0 ONCE lastPLosc = 0 once lastPHindex=-1 once lastPLindex=-1 ayiNormal=0 ayiGizli=0 bogaNormal=0 bogaGizli=0 // Actualizar valores del último Pivote ALTO IF pivotHighDetected and lastPHindex <> barindex[ir] THEN if lastPHindex<> -1 then if high[Ir]>LastPHprice and IrGo[Ir]<lastPHosc then ayiNormal = 1 endif if high[Ir]<lastPHprice and IrGo[Ir]>lastPHosc then ayiGizli = 1 endif endif lastPHprice = high[Ir] lastPHosc = IrGo[Ir] lastPHIndex=barindex[Ir] ENDIF // Actualizar valores del último Pivote BAJO IF pivotLowDetected and lastPLindex<>barindex[Ir] THEN if lastPLindex<>-1 then if low[Ir]<lastPLprice and IrGo[Ir]>lastPLosc then bogaNormal=1 endif if low[Ir]<lastPLprice and IrGo[Ir]<lastPLosc then bogaGizli=1 endif endif lastPLprice = low[Ir] lastPLosc = IrGo[Ir] lastPLindex = barindex[Ir] ENDIF // --- Dibujo de Etiquetas de Divergencia --- atr=averagetruerange[14](close) // Normal Alcista IF gosterNormal AND bogaNormal THEN DRAWTEXT("Bull", barindex[Ir], low[Ir] - 0.15*atr ) COLOURED("green") ENDIF // Oculta Alcista IF gosterGizli AND bogaGizli THEN DRAWTEXT("hid.Bull", barindex[Ir], low[Ir] - 0.15*atr) COLOURED("lime") ENDIF // Normal Bajista IF gosterNormal AND ayiNormal THEN DRAWTEXT("Bear", barindex[Ir], high[Ir] + 0.15*atr) COLOURED("red") ENDIF // Oculta Bajista IF gosterGizli AND ayiGizli THEN DRAWTEXT("hid.Bear", barindex[Ir], high[Ir] + 0.15*atr) COLOURED("orange") ENDIF // -----------------------------------------------------------------------------\\ // --- Salida de Datos (Plot) // -----------------------------------------------------------------------------// RETURN Ust COLOURED(255, 82, 82, gosterBand*128) STYLE(POINT, 2) AS "Upper Band", Alt COLOURED(0, 230, 119, gosterBand*128) STYLE(POINT, 2) AS "Lower Band", Dvd as "Dvd Line" coloured(Rdvd,Gdvd,Bdvd)style(line,3), orta as "Middle band"coloured(Rorta,Gorta,Borta,80)style(line,3) |
Share this
No information on this site is investment advice or a solicitation to buy or sell any financial instrument. Past performance is not indicative of future results. Trading may expose you to risk of loss greater than your deposits and is only suitable for experienced investors who have sufficient financial means to bear such risk.
ProRealTime ITF files and other attachments :
Find other exclusive trading pro-tools on ![]()
PRC is also on YouTube, subscribe to our channel for exclusive content and tutorials


thank you for the work, can you improve by displaying the price level and the time of the signal on the graph?
Hi! you can do it adding below current signal lines.
c=close // define price to show in graph
drawtext(“#c#”,barindex[Ir], high[Ir] + 0.25*atr)