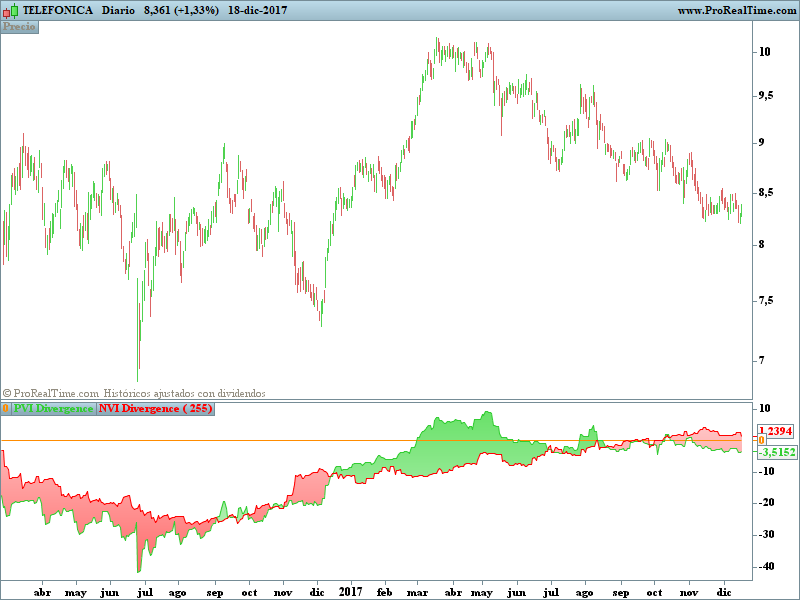
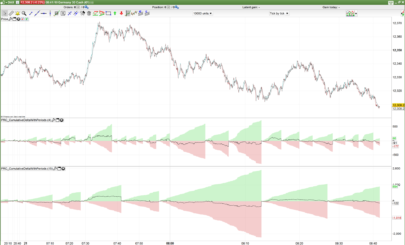
Adaptation for Prorealtime of the Dual Volume Divergence Index, created by Donovan Wall for the Tradingview platform.
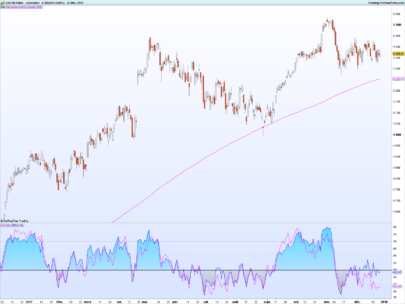
This is an experimental variation of Paul L. Dysart’s Positive Volume Index and Negative Volume Index that tracks the divergences between the PVI and its EMA, and the NVI and its EMA, then plots both together for comparison. This tool can be used to identify trending price activity.
|
1 2 3 4 5 6 7 8 9 10 11 12 13 14 15 16 17 18 19 20 21 22 23 24 25 26 27 28 29 30 31 32 33 34 35 36 37 38 39 40 41 42 43 44 45 46 |
REM DUAL VOLUME DIVERGENCE INDEX [DW] //@version=2 //by Donovan Wall //adapted for the Prorealtime platform by bolsatrilera //This is an experimental variation of Paul L. Dysart's Positive Volume Index and Negative Volume Index that tracks the divergences between the PVI and its EMA, and the NVI and its EMA, then plots both together for comparison. //This tool can be used to identify trending price activity. //---------------------------------------------------------------------------------------------------------------------------------------------------------------- //Inputs //---------------------------------------------------------------------------------------------------------------------------------------------------------------- //Period //per = 255 // title="EMA Period" //---------------------------------------------------------------------------------------------------------------------------------------------------------------- //Definitions //---------------------------------------------------------------------------------------------------------------------------------------------------------------- //Rate of Change rocc = roc[1](close) //Positive Volume Divergence Index if volume > volume[1] then pvi= pvi[1]+rocc else pvi= pvi[0] endif psig = ExponentialAverage[per](pvi) pdiv = pvi - psig //Negative Volume Divergence Index if volume <volume[1] then nvi= nvi[1]-rocc else nvi= nvi[0] endif nsig = ExponentialAverage[per](nvi) ndiv = nvi - nsig //Center cent = 0 return cent coloured (255,140,0)as "0", pdiv coloured(50,205,50)as "PVI Divergence",ndiv coloured(255,0,0)as"NVI Divergence" |
Share this
No information on this site is investment advice or a solicitation to buy or sell any financial instrument. Past performance is not indicative of future results. Trading may expose you to risk of loss greater than your deposits and is only suitable for experienced investors who have sufficient financial means to bear such risk.
ProRealTime ITF files and other attachments :
Find other exclusive trading pro-tools on ![]()
PRC is also on YouTube, subscribe to our channel for exclusive content and tutorials


ciao, ho provato l’indicatore e mi sembra interessante, ma in fase di backtest non riesco ad analizzare oltre gli ultimi 5 anni. Qualcuno può spiegarmi il perchè? ringrazio anticipatamente
veramente bello…..complimenti