The Dual Thrust trading algorithm is a famous strategy developed by Michael Chalek. It has been commonly used in futures, forex and equity markets. The idea of Dual Thrust is similar to a typical breakout system, however dual thrust uses the historical price to construct update the look back period — theoretically making it more stable in any given period.
Calculation parameters and upper and lower rails
(1). The highest price of N on High, HH, the lowest price of Close on N Day;
(2). The highest price of Closed N on the N day, the lowest price LL of Low on the N day;
(3). Range = Max(HH – LC, HC – LL)
(4). Calculate the upper track: Buyline = Open + K1 * Range
(5). Calculate the lower rail: Sellline = Open – K2 * Range
Construction system
(1). When the price breaks above the upper rail, if it holds the short position at that time, it will close the position first and then open the multiple position; if there is no position, it will open the multiple position directly.
(2). When the price breaks down the lower track, if it holds multiple positions at that time, it will close the position first, then open the short position; if there is no position, open the short position directly.
Dual Thrust feature
When K1<K2, the long is relatively easy to be triggered; when K1>K2, the short is relatively easy to be triggered, and when K1>K2, the short is relatively easy to be triggered. Therefore, when using this strategy, investors can refer to the optimal parameters of historical data testing on the one hand, and on the other hand, they can start with their own judgments on the post-trend or from other major cycle technical indicators. Adjust the values of K1 and K.
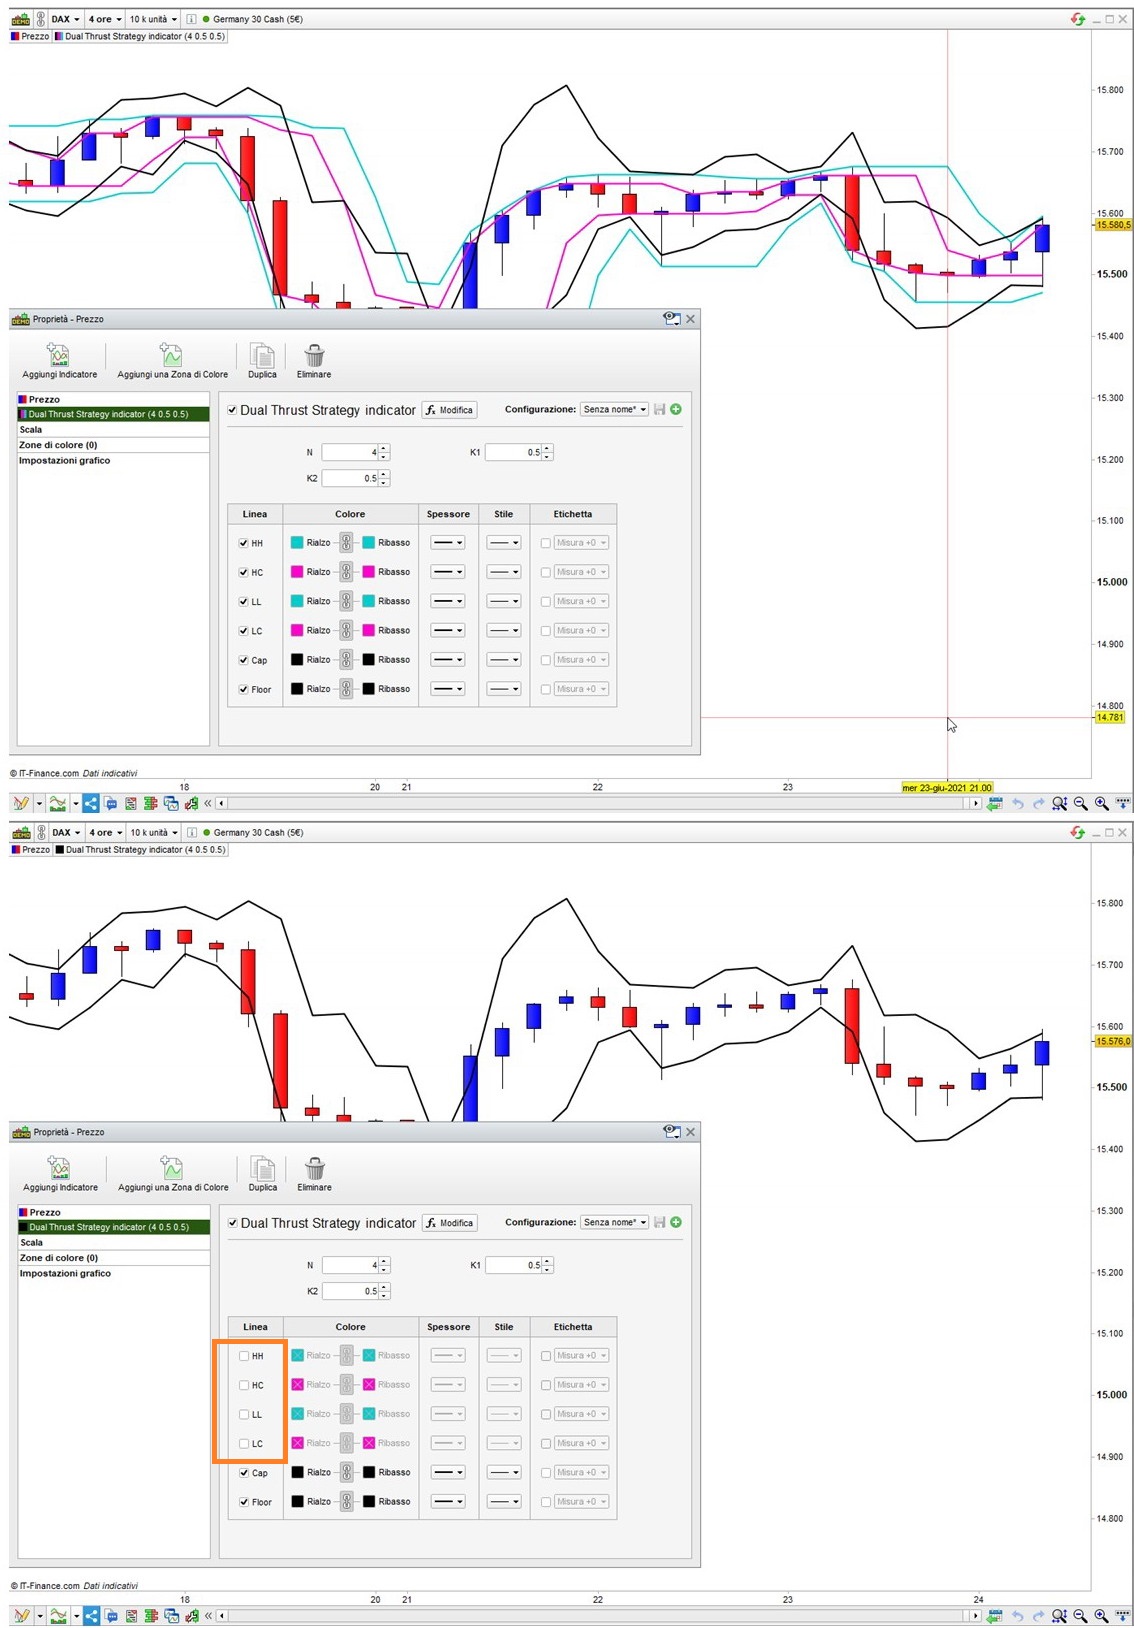
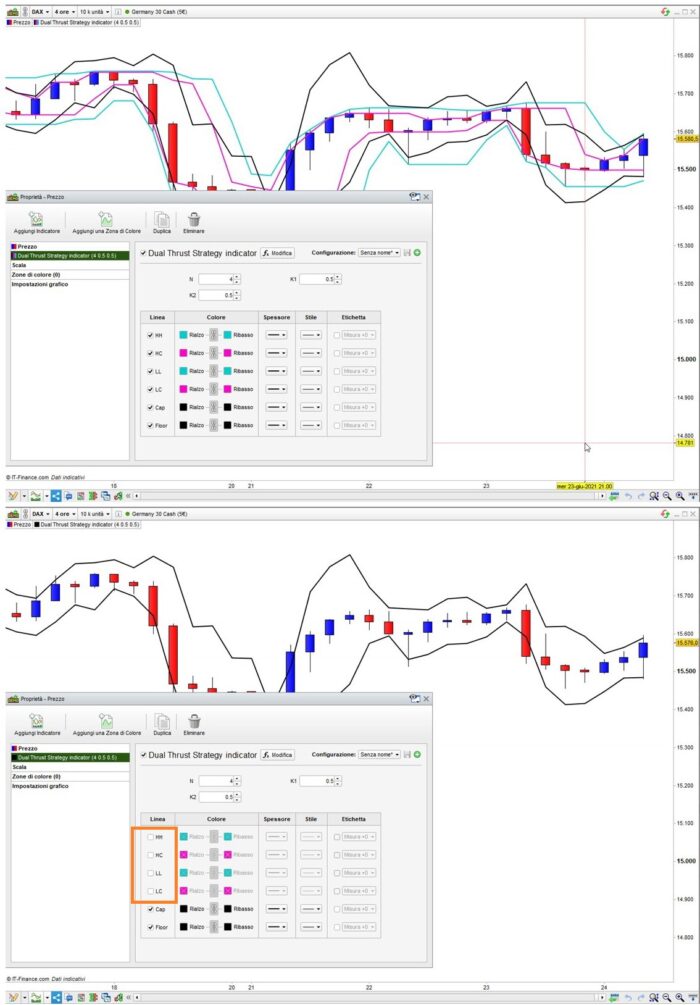
Following this request https://www.prorealcode.com/topic/convert-request-dual-thrust-trading-algorithm/, I wrote this indicator, to visually help coding a strategy.
|
1 2 3 4 5 6 7 8 9 10 11 12 13 14 15 16 17 |
// Dual Thrust Strategy indicator // //ONCE N = 4 //4 periods //ONCE K1 = 0.5 //0.5 K1 factor //ONCE K2 = 0.5 //0.5 K2 factor N = max(1,min(999,N)) // Bands HH = highest[N](high) HC = highest[N](close) LL = lowest[N](low) LC = lowest[N](close) // Range RNG = max(HH - LC,HC - LL) // Cap & Floor Cap = open + (RNG * K1) //Cap Flr = open - (RNG * K2) //Floor RETURN HH AS "HH",HC AS "HC",LL AS "LL",LC AS "LC",Cap AS "Cap",Flr AS "Floor" |
Share this
No information on this site is investment advice or a solicitation to buy or sell any financial instrument. Past performance is not indicative of future results. Trading may expose you to risk of loss greater than your deposits and is only suitable for experienced investors who have sufficient financial means to bear such risk.
ProRealTime ITF files and other attachments :
Find other exclusive trading pro-tools on ![]()
PRC is also on YouTube, subscribe to our channel for exclusive content and tutorials