
Demand/Supply Zones Indicator: An Essential Tool for Technical Analysis in ProRealTime
Introduction
I want to introduce you to the Demand/Supply Zones indicator. As the name suggests, this indicator specifically focuses on the zones of demand and supply, which are fundamental in the analysis of supports and resistances.
The theory behind this indicator is that prices show predictable reactions as they approach these zones, which can be leveraged to make more precise buying or selling operations.
Thus, the Demand/Supply Zones indicator becomes a very powerful tool for those interested in including a study of supports and resistances in their technical analysis, automatically highlighting key market levels.
Importance of the Indicator
The relevance of the Demand/Supply Zones indicator lies in its ability to break down and visualize zones where significant orders of buying or selling are concentrated, influencing the future price behavior. By identifying these zones, traders can strategically plan their entry and exit points, capitalizing on trend reversals or continuations of price movements.
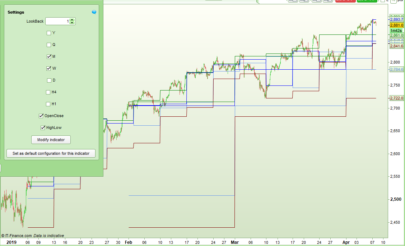
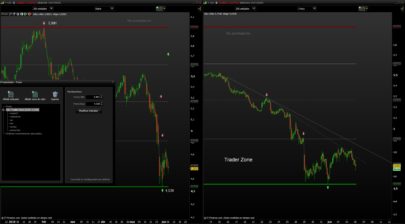
This indicator is especially useful due to its adaptability and customization through the indicator settings window. Later we will see, but there are many parameters that can be adjusted in the indicator according to the specific needs of the trader.
In the next section, we will detail the operation of the Demand/Supply Zones indicator and how it interprets price action to signal the zones of demand and supply, fundamental for decision making in trading.
Functioning of the Indicator
The Demand/Supply Zones indicator is designed to identify and effectively visualize the zones of demand (support) and supply (resistance). This analysis is based on the observation of historical price patterns and uses various parameters to precisely determine these critical areas where the price is likely to experience significant changes.
Identification of Demand and Supply Zones
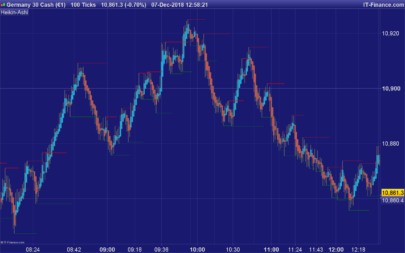
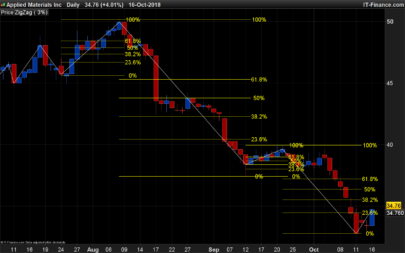
The identification of these zones is carried out through the analysis of price pivots, which are points on the chart where the price has significantly changed direction. The indicator marks these points using specific criteria of period and amplitude, thus allowing the visualization of zones where there has historically been an accumulation of buying (demand) or selling (offer) orders.
Key Parameters
Pivot Period (prd): This parameter determines the time interval for the analysis of pivots, directly influencing the sensitivity of the indicator to price changes.
Price Source Selection (ppsrc): Allows choosing between the high/low and close/open for the calculation of pivots, adjusting the focus of the indicator to the most relevant price action for the trader.
Channel Width (channelw): Defines the maximum percentage of channel width that can exist between zones of support and resistance, thus filtering the zones according to their relevance.
Maximum Number of S/R (maxnumsr): Limits the number of support and resistance zones to be shown, allowing focus on the most significant ones.
Practical Application and Signals
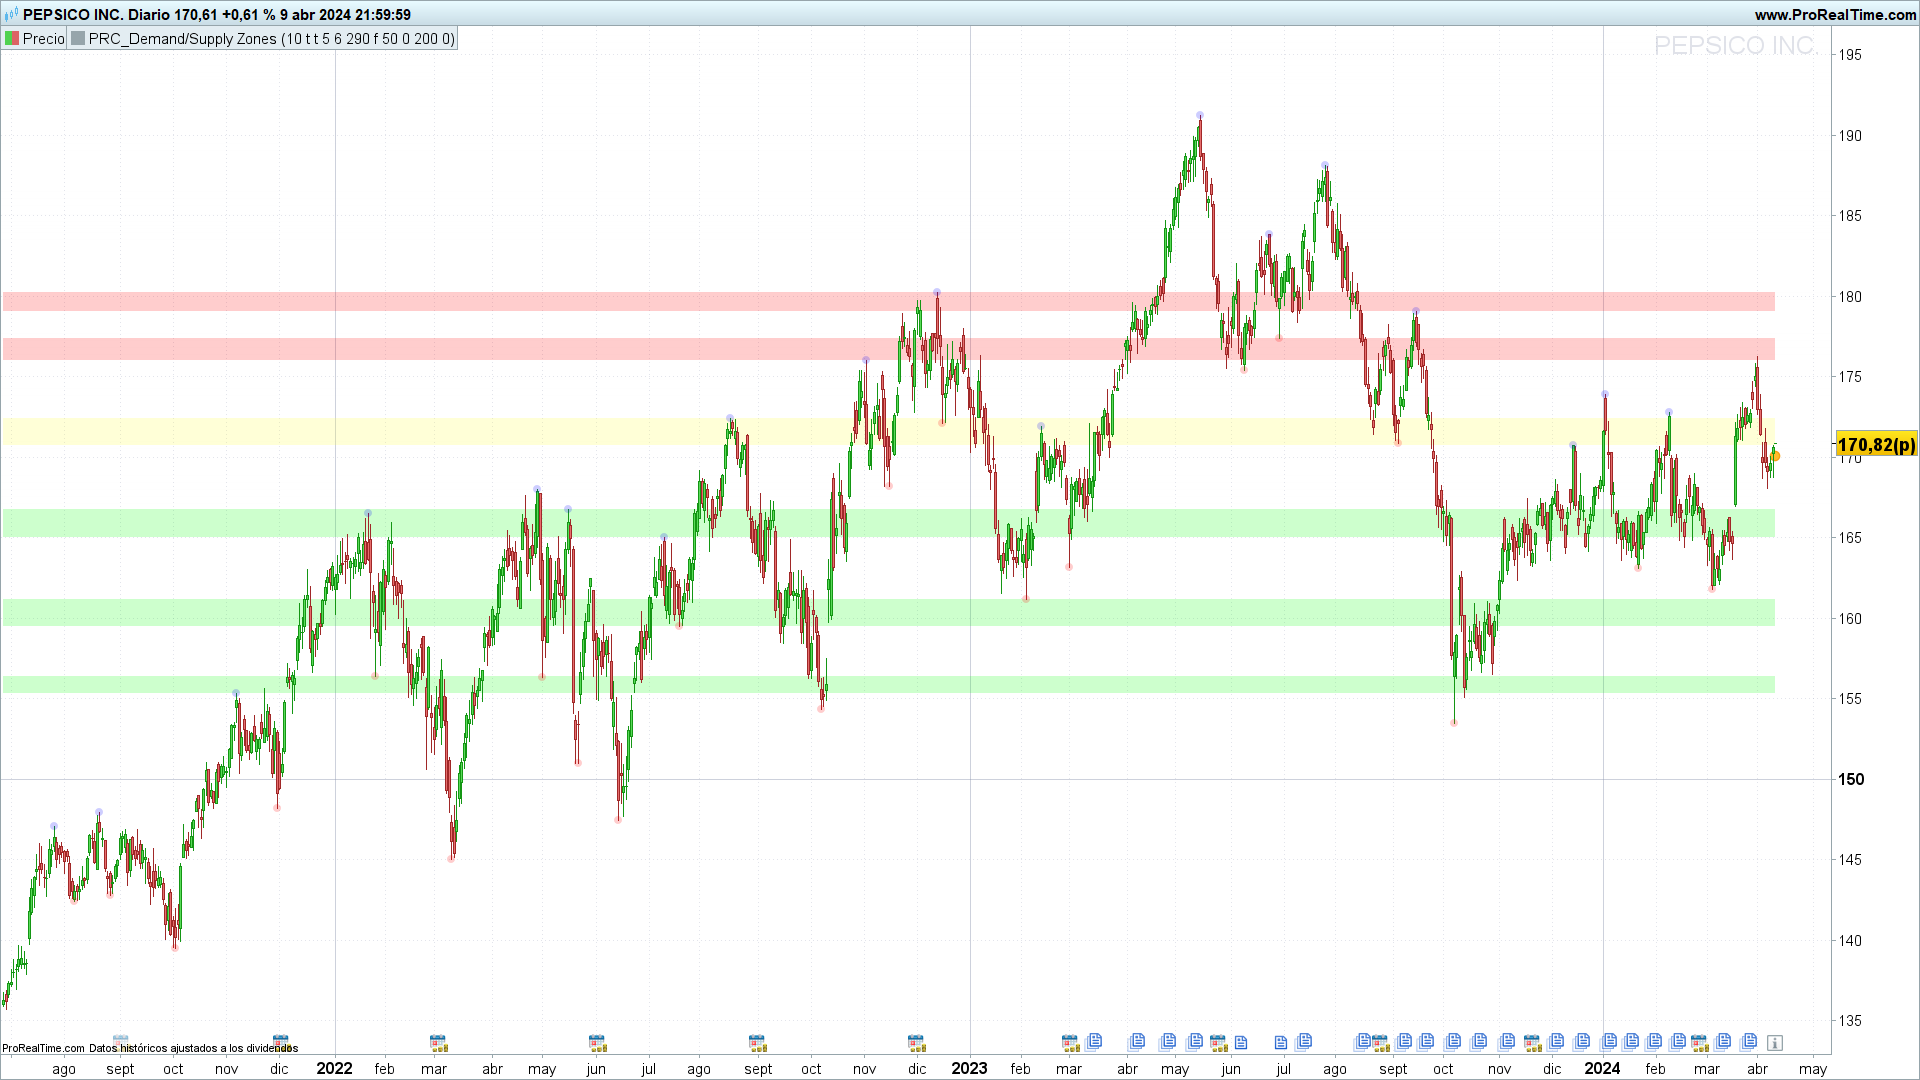
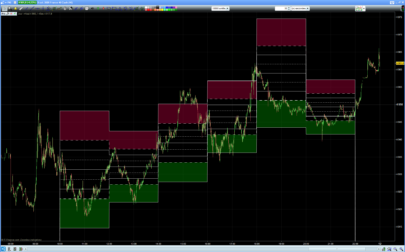
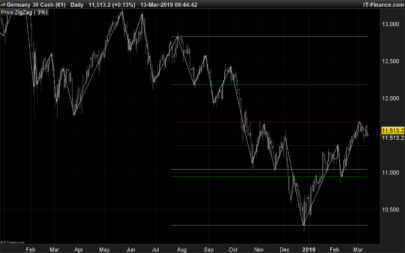
The indicator uses these parameters to plot zones of demand and supply on the chart, which can be interpreted as signals for buying or selling operations. A strong demand zone may indicate a good buying point, anticipating a bounce upwards, while a significant supply zone may suggest a selling point, anticipating a drop in price.
The zones identified by the indicator can also be used to establish stop-loss or take-profit levels, improving risk management in operations.
The Demand/Supply Zones indicator offers a clear and detailed view of the interest zones in the market, providing traders with a valuable tool to enhance their technical analysis and decision-making. The customization of its parameters allows adapting the indicator to any trading strategy, making it an indispensable complement in the arsenal of any trader.
Integration with Other Analysis Tools
The Demand/Supply Zones indicator, with its ability to precisely identify demand and supply zones, is a highly powerful technical analysis tool by itself. However, its integration with other techniques and analysis tools can further enrich the trading strategy, offering a more complete view of the market and helping to confirm detected signals.
Combination with Trend Indicators
Integrating the Demand/Supply Zones with trend indicators such as moving averages (Simple Moving Average – SMA or Exponential Moving Average – EMA) or the ADX (Average Directional Index) can provide a deeper understanding of the general market direction. By identifying a demand or supply zone in alignment with the overall trend, signals of higher probability can be filtered, thus increasing the effectiveness of operations.
Synergy with Volume Indicators
Trading volume is a critical component that can validate the strength of a demand or supply zone. Tools like the On-Balance Volume (OBV) or the Volume Oscillator can be used in conjunction with the Demand/Supply Zones to confirm the presence of buyer or seller interest in the identified zones. A significant increase in volume approaching a supply zone may indicate strong selling pressure, and vice versa for demand zones.
Application of Divergence Tools
Divergence between the price and a momentum indicator like the RSI (Relative Strength Index) or the MACD (Moving Average Convergence Divergence) can be another powerful filter when used alongside the Demand/Supply Zones indicator. Identifying a bearish divergence in a supply zone, or a bullish divergence in a demand zone, can provide early signals of possible price reversals.
Confirmation Strategies
Using the Demand/Supply Zones in combination with Japanese candlestick patterns or chartist figures such as triangles, head and shoulders, or flags, can provide an additional level of confirmation for operations. The appearance of a reversal or continuation pattern in or near a key zone can be a strong signal to enter or exit the market.
Conclusion
The integration of the Demand/Supply Zones indicator with other tools and analysis techniques not only strengthens the validity of trading signals but also provides a more robust and holistic strategy. The key lies in the selection and combination of appropriate tools that complement and confirm the generated signals, allowing for more informed decision-making and potentially more profitable trading.
This integrative approach highlights the importance of a well-rounded trading strategy, where different tools work together to provide a comprehensive view of the market, facilitating the identification of trading opportunities with a higher degree of confidence.
|
1 2 3 4 5 6 7 8 9 10 11 12 13 14 15 16 17 18 19 20 21 22 23 24 25 26 27 28 29 30 31 32 33 34 35 36 37 38 39 40 41 42 43 44 45 46 47 48 49 50 51 52 53 54 55 56 57 58 59 60 61 62 63 64 65 66 67 68 69 70 71 72 73 74 75 76 77 78 79 80 81 82 83 84 85 86 87 88 89 90 91 92 93 94 95 96 97 98 99 100 101 102 103 104 105 106 107 108 109 110 111 112 113 114 115 116 117 118 119 120 121 122 123 124 125 126 127 128 129 130 131 132 133 134 135 136 137 138 139 140 141 142 143 144 145 146 147 148 149 150 151 152 153 154 155 156 157 158 159 160 161 162 163 164 165 166 167 168 169 170 171 172 173 174 175 176 177 178 179 180 181 182 183 |
//--------------------------------------------------------// //PRC_Demand/Supply Zones //version = 0 //08.04.24 //Iván González @ www.prorealcode.com //Sharing ProRealTime knowledge //--------------------------------------------------------// //-----inputs--------------------------------------------// prd = 10 //Pivot period ppsrc = 1// 1 = "high/low" // 0 = "close/open" showpp = 1//Show Pivot Points channelw = 5 //Maximum channel width % maxnumsr = 6 //Maximum Number of S/R loopback = 290 //Loopback Period ShowEMA = 0 //Show moving averages ma1len = 50 //MA 1 ma1type = 0 //sma=0 ema=1 ma2len = 200 //MA 2 ma2type = 0 //sma=0 ema=1 //-------------------------------------------------------// //-----AVERAGES------------------------------------------// if ShowEMA then ma1 = average[ma1len,ma1type](close) ma2 = average[ma2len,ma2type](close) else ma1 = undefined ma2 = undefined endif //-------------------------------------------------------// //-----Get Pivot high / low------------------------------// if ppsrc then src1 = low src2 = high else src1 = max(close,open) src2 = min(close,open) endif //-----pivots low if src1 > src1[prd] and lowest[prd](src1) > src1[prd] and src1[prd] < lowest[prd](src1)[prd+1] then $pivotlowy[z+1] = src1[prd] $pivotlowx[z+1] = barindex[prd] z=z+1 endif //-----pivots high if src2 < src2[prd] and highest[prd](src2)<src2[prd] and src2[prd]>highest[prd](src2)[prd+1] then $pivothighy[t+1]=src2[prd] $pivothighx[t+1]=barindex[prd] t=t+1 endif //-------------------------------------------------------// //-----Draw pivot points---------------------------------// if showpp and z <> z[1] then drawpoint($pivotlowx[z],$pivotlowy[z],2)coloured("red",50) elsif showpp and t <> t[1] then drawpoint($pivothighx[t],$pivothighy[t],2)coloured("blue",50) endif //-------------------------------------------------------// //-----Calculate maximum S/R channel width---------------// prdhighest = highest[300](high) prdlowest = lowest[300](low) cwidth = (prdhighest - prdlowest) * ChannelW / 100 //-------------------------------------------------------// //-----Get/keep Pivot levels-----------------------------// if z <> z[1] then $pivotvals[m+1]=src1[prd] $pivotlocs[m+1]=barindex[prd] m=m+1 elsif t <> t[1] then $pivotvals[m+1]=src2[prd] $pivotlocs[m+1]=barindex[prd] m=m+1 endif //-------------------------------------------------------// //-----Calculate Strengs---------------------------------// if islastbarupdate then //get levels and strengs for x=0 to m-1 do lo=$pivotvals[x] hi=lo numpp=0 for Y= 0 to m-1 do cpp=$pivotvals[y] if cpp <=hi then wdth=hi-cpp else wdth=cpp-lo endif if wdth<=cwidth then numpp=numpp+20 if cpp<=hi then lo=min(lo,cpp) else hi=max(hi,cpp) endif endif next $lo[x]=lo $hi[x]=hi $strength[x]=numpp next //add each HL to strengh for z=0 to m-1 do lo2=$lo[z] hi2=$hi[z] s=0 for t=0 to loopback do if (high[t]<=hi2 and high[t]>=lo2) or (low[t]<=hi2 and low[t]>=lo2) then s=s+1 endif $strength[z]=$strength[z]+s next next endif //-------------------------------------------------------// //-----Support&Resistance levels Array-------------------// //reset SR levels unset($suportresistance) // get strongest SRs src=0 for i=0 to m-1 do stv=-1 stl=-1 for j=0 to m-1 do if $strength[j]>stv and $strength[j]>=20 then stv=$strength[j] stl=j endif next if stl>=0 then //get sr level hh=$hi[stl] ll=$lo[stl] $suportresistance[src*2]=hh $suportresistance[src*2+1]=ll $stren[src]=$strength[stl] // make included pivot points' strength zero for n=0 to m-1 do if ($hi[n]<=hh and $hi[n]>=ll) or ($lo[n]<=hh and $lo[n]>=ll) then $strength[n]=-1 endif next src=src+1 if src>=10 then break endif endif next //-------------------------------------------------------// //-----Draw Support&Resistance---------------------------// for x=0 to min(9,maxnumsr-1) do //Calculate Top level if x*2 < LastSet($suportresistance) then if $suportresistance[x*2] <> 0 then boxtop = $suportresistance[x*2] endif endif //Calculate Bottom level if x*2+1 < LastSet($suportresistance) then if $suportresistance[x*2+1] <> 0 then boxbot = $suportresistance[x*2+1] endif endif //Color definition if close > boxtop then r=0 g=255 b=0 elsif close < boxbot then r=255 g=0 b=0 else r=255 g=255 b=50 endif //Draw rectangle drawrectangle(0,boxtop,barindex,boxbot)coloured(r,g,b,0)fillcolor(r,g,b,50) next //-------------------------------------------------------// return ma1 as "SMA 1" coloured("blue"),ma2 as "SMA 2" coloured("red") |
Share this
No information on this site is investment advice or a solicitation to buy or sell any financial instrument. Past performance is not indicative of future results. Trading may expose you to risk of loss greater than your deposits and is only suitable for experienced investors who have sufficient financial means to bear such risk.
ProRealTime ITF files and other attachments :
Find other exclusive trading pro-tools on ![]()
PRC is also on YouTube, subscribe to our channel for exclusive content and tutorials


Impressive work. Accurate, interesting, good background. You hit the nail on the head again. Thanks a million¡
🙂
Such a wonderful work, thanks Ivan…………..
This is amazing work. Well done, Ivan!
🙂
Bonjour Ivan serait il possible de proposer un screener pour détecter les zones de support vertes?
merci d’avance
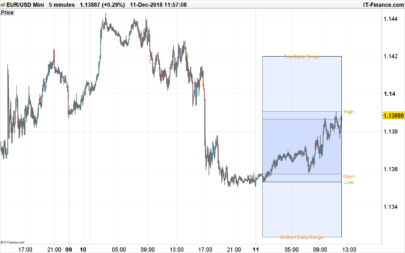
Hello Ivan ! A belated HNY ! I know late ! Quick question on theis great indicator plse. I understand the objective of the indicator, but as newbie I dont understand 2 things: 1/ what does the yellow highlighted area represents ? Consolidation ? 2/ The light circles at a given wick…is that a local high or low ? Thanks in advance ! Kind rgds Mike
Wow! This is GOLD! Great job!