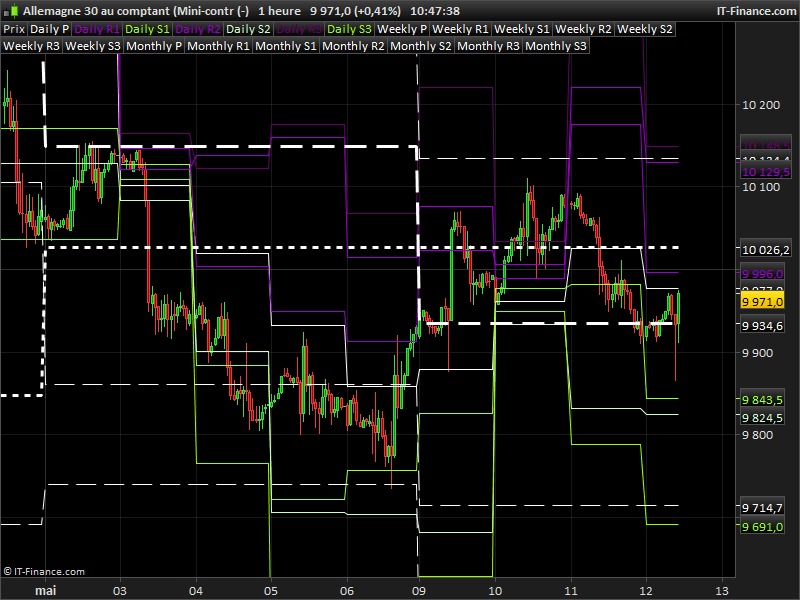
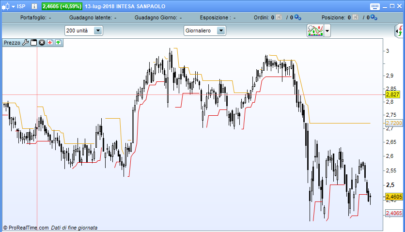
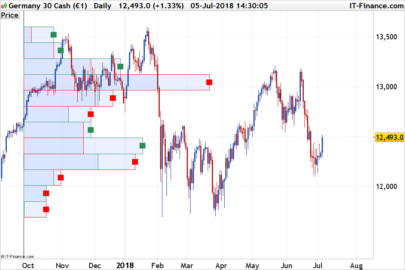
This indicator embed the daily, weekly and monthly pivot points with choice of their mode of calculation.
Each support and resistance of the daily, weekly and monthly pivot formulas are rendered on chart. Since pivot points indicator is a common request, I found this one to answer perfectly to a lot of them!
This code has been posted on forum by Henry, many thanks to him.
|
1 2 3 4 5 6 7 8 9 10 11 12 13 14 15 16 17 18 19 20 21 22 23 24 25 26 27 28 29 30 31 32 33 34 35 36 37 38 39 40 41 42 43 44 45 46 47 48 49 50 51 52 53 54 55 56 57 58 59 60 61 62 63 64 65 66 67 68 69 70 71 72 73 74 75 76 77 78 79 80 81 82 83 84 85 86 87 88 89 90 91 92 93 94 95 96 97 |
//Pivot calculation method Once mode = 1 Once dailyPivot = undefined Once dailyR1 = undefined Once dailyS1 = undefined Once dailyR2 = undefined Once dailyS2 = undefined Once dailyR3 = undefined Once dailyS3 = undefined Once lastWeekBarIndex = 0 Once weeklyHigh = undefined Once weeklyLow = undefined Once weeklyPivot = undefined Once weeklyR1 = undefined Once weeklyS1 = undefined Once weeklyR2 = undefined Once weeklyS2 = undefined Once weeklyR3 = undefined Once weeklyS3 = undefined Once lastMonthBarIndex = 0 Once monthlyHigh = undefined Once monthlyLow = undefined Once monthlyPivot = undefined Once monthlyR1 = undefined Once monthlyS1 = undefined Once monthlyR2 = undefined Once monthlyS2 = undefined Once monthlyR3 = undefined Once monthlyS3 = undefined If Day>Day[1] then If mode = 0 then dailyPivot = (DHigh(1) + DLow(1) + Close[1]) / 3 Elsif mode = 1 then dailyPivot = (Open + DHigh(1) + DLow(1) + Close[1]) / 4 Elsif mode = 2 then dailyPivot = (DHigh(1) + DLow(1) + Close[1]*2) / 4 Else dailyPivot = (Open*2 + DHigh(1) + DLow(1)) / 4 Endif dailyR1 = 2*dailyPivot - DLow(1) dailyS1 = 2*dailyPivot - DHigh(1) dailyR2 = dailyPivot + (DHigh(1) - DLow(1)) dailyS2 = dailyPivot - (DHigh(1) - DLow(1)) dailyR3 = dailyR1 + (DHigh(1) - DLow(1)) dailyS3 = dailyS1 - (DHigh(1) - DLow(1)) Endif If DayOfWeek<DayOfWeek[1] then weeklyHigh = Highest[BarIndex - lastWeekBarIndex](High)[1] weeklyLow = Lowest[BarIndex - lastWeekBarIndex](Low)[1] lastWeekBarIndex = BarIndex If mode = 0 then weeklyPivot = (weeklyHigh + weeklyLow + Close[1]) / 3 Elsif mode = 1 then weeklyPivot = (Open + weeklyHigh + weeklyLow + Close[1]) / 4 Elsif mode = 2 then weeklyPivot = (weeklyHigh + weeklyLow + Close[1]*2) / 4 Else weeklyPivot = (Open*2 + weeklyHigh + weeklyLow) / 4 Endif weeklyR1 = 2*weeklyPivot - weeklyLow weeklyS1 = 2*weeklyPivot - weeklyHigh weeklyR2 = weeklyPivot + (weeklyHigh - weeklyLow) weeklyS2 = weeklyPivot - (weeklyHigh - weeklyLow) weeklyR3 = weeklyR1 + (weeklyHigh - weeklyLow) weeklyS3 = weeklyS1 - (weeklyHigh - weeklyLow) Endif If Month<>Month[1] then monthlyHigh = Highest[BarIndex - lastMonthBarIndex](High)[1] monthlyLow = Lowest[BarIndex - lastMonthBarIndex](Low)[1] lastMonthBarIndex = BarIndex If mode = 0 then monthlyPivot = (monthlyHigh + monthlyLow + Close[1]) / 3 Elsif mode = 1 then monthlyPivot = (Open + monthlyHigh + monthlyLow + Close[1]) / 4 Elsif mode = 2 then monthlyPivot = (monthlyHigh + monthlyLow + Close[1]*2) / 4 Else monthlyPivot = (Open*2 + monthlyHigh + monthlyLow) / 4 Endif monthlyR1 = 2*monthlyPivot - monthlyLow monthlyS1 = 2*monthlyPivot - monthlyHigh monthlyR2 = monthlyPivot + (monthlyHigh - monthlyLow) monthlyS2 = monthlyPivot - (monthlyHigh - monthlyLow) monthlyR3 = monthlyR1 + (monthlyHigh - monthlyLow) monthlyS3 = monthlyS1 - (monthlyHigh - monthlyLow) Endif Return dailyPivot as "Daily P", dailyR1 as "Daily R1", dailyS1 as "Daily S1", dailyR2 as "Daily R2", dailyS2 as "Daily S2", dailyR3 as "Daily R3", dailyS3 as "Daily S3", weeklyPivot as "Weekly P", weeklyR1 as "Weekly R1", weeklyS1 as "Weekly S1", weeklyR2 as "Weekly R2", weeklyS2 as "Weekly S2", weeklyR3 as "Weekly R3", weeklyS3 as "Weekly S3", monthlyPivot as "Monthly P", monthlyR1 as "Monthly R1", monthlyS1 as "Monthly S1", monthlyR2 as "Monthly R2", monthlyS2 as "Monthly S2", monthlyR3 as "Monthly R3", monthlyS3 as "Monthly S3" |
Share this
No information on this site is investment advice or a solicitation to buy or sell any financial instrument. Past performance is not indicative of future results. Trading may expose you to risk of loss greater than your deposits and is only suitable for experienced investors who have sufficient financial means to bear such risk.
ProRealTime ITF files and other attachments :
Find other exclusive trading pro-tools on ![]()
PRC is also on YouTube, subscribe to our channel for exclusive content and tutorials


Good Morning. What type of Pivot is this. I notice it is not the Classic Pivot
Hello, you can change the pivot calculation mode by modifying the “mode” variable at line 2 from 0 to 3. This indicator embedded all kind of pivot calculation (classical, woodies, etc..)
Hello Nicolas! I’m having trouble using the monthly pivot part of this indicator into a strategy.
Here is an example of what I’m kind of trying to achieve;
DEFPARAM CUMULATEORDERS = FALSE
//
Once lastMonthBarIndex = 0
Once monthlyHigh = undefined
Once monthlyLow = undefined
Once monthlyPivot = undefined
If Month<>Month[1] then
monthlyHigh = Highest[BarIndex - lastMonthBarIndex](High)[1]
monthlyLow = Lowest[BarIndex - lastMonthBarIndex](Low)[1]
lastMonthBarIndex = BarIndex
monthlyPivot = (close[1] + monthlyHigh + monthlyLow) / 3
Endif
MM1 = AVERAGE[7](CLOSE)
//
C1 = MM1 CROSSES OVER MONTHLYPIVOT
IF NOT LONGONMARKET AND C1 THEN
BUY 1 CONTRACTS AT MARKET
SET STOP %LOSS 2
SET TARGET %PROFIT 5
ENDIF
What I’m doing wrong here? Answer would be much appreciated.
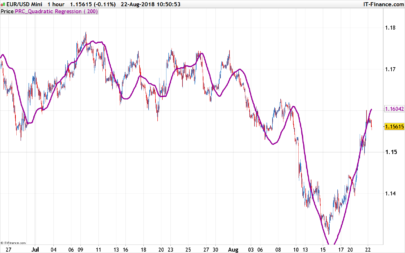
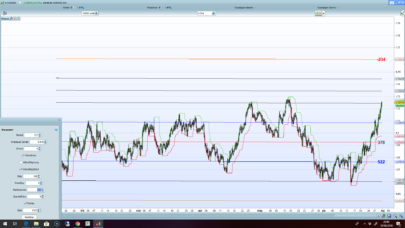
Thanks for the code.May it be possible to have the lines plotted in my chart? At this moment I got it in my indicator field which is a mess and not easy reading.
Use the wrench on the left upper side of the chart to apply an indicator on price.
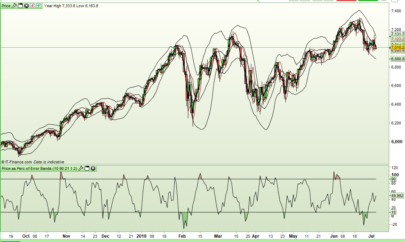
Hello Nicolas,
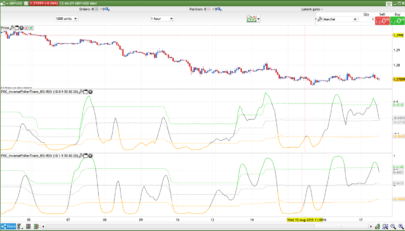
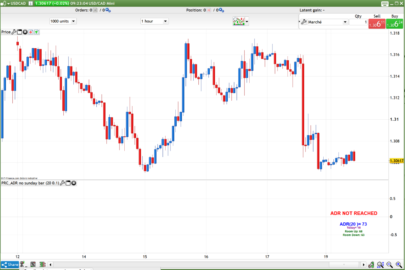
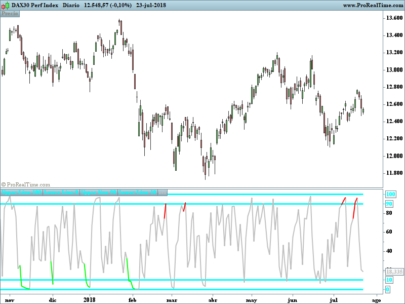
There is a small difference between the outcome of this weekly and monthly pivots (mode 0) with that of the standard ones as shown in the enclosed chart. The mismatch stays same whether I use Sunday bar or not. Is it possible to fix this.
Regards,
Thank you so much!
Bonjour,
Suite à des backtest, j’essai actuellement de tester les pivots Week et mensuel. Après plusieurs essais avec le code ci-dessus mes pivots ne correspondent pas aux pivots PRT par défaut.
Exemple :
J’ai testé individuellement le code du pivot Week suivant :
weeklyPivot = (weeklyHigh + weeklyLow + Close[1]) / 3
weeklyHigh = Highest[BarIndex – lastWeekBarIndex](High)[1]
weeklyLow = Lowest[BarIndex – lastWeekBarIndex](Low)[1]
lastWeekBarIndex = BarIndex
Mais le résultat ne me donne pas le bon pivot, avec la formule [(H+B+C)/3]
Aurais je une erreur dans le code ?
J’ai l’impression que le “lastweekbarindex” n’est pas reconnu convenablement,
Oui il y a de grosses différences entre ce code et les pivots Week/Mensuel malhereusement
Hello Nicolas,
I am unable to attach the image. How do I do it please to fix this issue.
Regards,
Hello,
Is it possible to modify the code to calculate pivots based on quarters? I mean, calculate pivots every quarter of the year (not last 3 months). How can I do that?
Hello
J’essaie d’importer ce code sur PRT11.
Mais malheureusement j’obtiens l’erreur “Un paramètre de type entier positif est attendu avec Highest”
Une idée sur ce qui peux provoquer cette erreur ?
Merci pour votre aide
Hello,
When I use the code above with no change at all, I get an error message stating that an entire and positive number is expected with “Highest”.
What’s wrong ?
Hi,
I have the same message error by importing the itf file, or by copying and pasting the code.
Idem