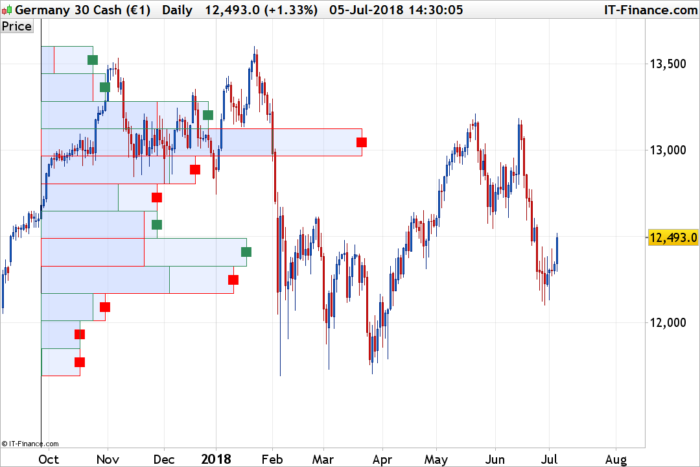
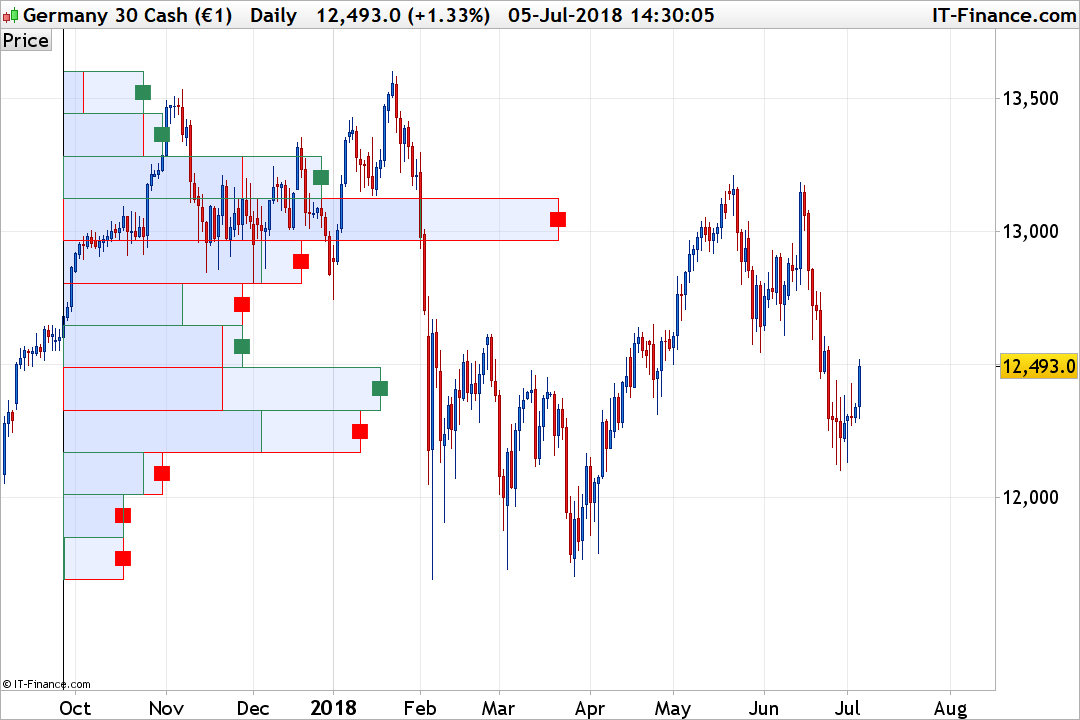
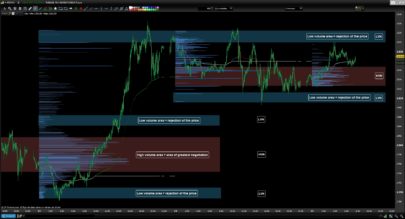
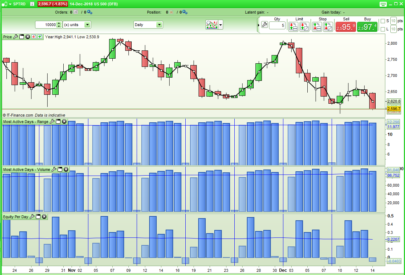
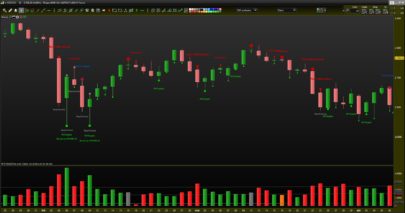
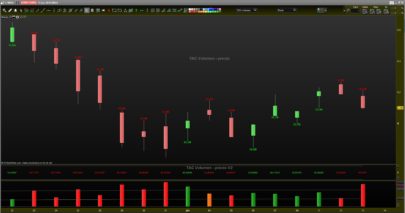
This “Volume-by-Price” indicator shows the amount of volume for a particular price range selected with the “lookback” setting, which is based on closing prices. The bars are horizontal and shown on the left side of the chart to correspond with these price ranges. The bars are separated into 2 colors to clearly identify the bull and bear Volumes in each price range. By combining volume and closing prices, this indicator can be used to identify high-volume price ranges to mark support or resistance.
The code shows 12 Volume-by-Price bars by default, but users can increase or decrease this number to suit their preferences with the “NbrBars” setting. Be aware that due to some ProBuilder limitations, this setting, as well as the lookback one, cannot be extended very much.
For a better visualization of which side has higher volumes on each price range, I added a small square of the corresponding color.
The ScaleFactor setting is used to adapt the length of the bars, depending of your choice to have small or big bars plotted over the price chart.
|
1 2 3 4 5 6 7 8 9 10 11 12 13 14 15 16 17 18 19 20 21 22 23 24 25 26 27 28 29 30 31 32 33 34 35 36 37 38 39 40 41 42 43 44 45 46 47 48 49 50 |
//PRC_Bull&Bear Volume on Price | indicator //05.07.2018 //Nicolas @ www.prorealcode.com //Sharing ProRealTime knowledge defparam drawonlastbaronly=true defparam calculateonlastbars=1000 // --- settings ScaleFactor = 5 NbrBars=12 lookback=200 // --- end of settings hh=highest[lookback](high) ll=lowest[lookback](low) div = (hh-ll)/NbrBars i=0 volsum=summation[lookback](volume) startbar = barindex[lookback] while i<NbrBars do lrange=ll+div*i hrange=lrange+div volbull=0 volbear=0 for j = 1 to lookback do if close[j]>=lrange and close[j]<=hrange then if close[j]>open[j] then volbull=volbull+volume[j] else volbear=volbear+volume[j] endif endif next bullbar = round((volbull*lookback)/volsum)*scalefactor bearbar = round((volbear*lookback)/volsum)*scalefactor drawrectangle(startbar,lrange,startbar+bullbar,hrange) coloured(46,139,87) drawrectangle(startbar,lrange,startbar+bearbar,hrange) coloured(255,0,0) if bullbar>bearbar then drawtext("■",startbar+bullbar,(lrange+hrange)/2,Dialog,Bold,22) coloured(46,139,87) else drawtext("■",startbar+bearbar,(lrange+hrange)/2,Dialog,Bold,22) coloured(255,0,0) endif i=i+1 wend drawvline(barindex[lookback]) return |
Share this
No information on this site is investment advice or a solicitation to buy or sell any financial instrument. Past performance is not indicative of future results. Trading may expose you to risk of loss greater than your deposits and is only suitable for experienced investors who have sufficient financial means to bear such risk.
ProRealTime ITF files and other attachments :
Find other exclusive trading pro-tools on ![]()
PRC is also on YouTube, subscribe to our channel for exclusive content and tutorials


Love It!
Great job, just what I needed.
The only problem is that it takes forever to load, even after changing calculateonlastbars=200
You’ll need at least 201 bars for a 200 bars lookback. About loading time, I can’t help more sorry …
Loading time is surmountable if you trade om the daily timeframe.
Great!
do u have indicator for binary???
Bonjour Nicolas, Merci ! Excellent code. Les zones sont à égales distances les unes des autres. Y aurait pas moyen d’affiner ?
Désolé je n’ai pas compris la question.
Excuse-moi, je n’étais peut être pas clair. Sur certaines zones, le prix passe à de très nombreuses reprises sur d’autres beaucoup moins. J’aimerai pouvoir différencier cela. Est-ce possible ?
Je ne comprends pas de quelles zones on parle ? Le graphique représenté ici est simplement une somme des volumes sur les x dernières périodes et divisé en 12 parts égales.
Ok je comprend mieux. Merci Nicolas
Bonjour, si je souhaite utiliser l’indicateur “Market profile” : “Bull & Bear Volume-by-Price levels” et que je travaille sur une unité de temps 30Min! Alors je voudrais l’avoir en debut de journée. par exemple : ouverture DAX30 8:00 la ligné de départ comme a partir de 8:00.
Il faut donc calculer comme cela : 22:00 (heure fermeture DAX30) – 8:00 (ouverture DAX30) = 14h00 de temps donc pour des bougies de 30Min il faut 14*2=28 (28 correspond au nombre de périodes à renseigner ?) pour pouvoir commencer au debut de la journée ?
Hi Nicholas…the system shows me two errors. The first one is this: PRC_Bull&Bear Volume on Price (5 12 200); the second one is on the line 6, character 10 (defparam drawonlastbaronly=true). I took a picture of it but I dont’k how to attach it here.
Thanks in advance
Indicator is compatible from version 10.3
To avoid code problems with bad copy paste, you should download the. .itf file and import it into your platform.
Thanks Nicholas: I did it. I mean that I’ve imported the itf file that you’ve charged above, but it isn’t still working. I can’t understand what’s the problem
Hallo Nicholas…I’ve been waiting for your aswer: maybe you can’t help me. All the best
I think you have not a compatible version of PRT. What’s your broker?
My broker is Binck bank, and I’m actually using version 10.2 (I think that Binck as a kind of use license for prorealtime)
Has a kind…sorry for the mistake
Ok, so that confirm what I replied to you 7 days ago, your PRT version is too old and not compatible for graphics objects created by code.
i nicoles i have posted a new forum topic with your indicator, to search for help.
Hola Nicolas enhorabuena por el indicador podrías agregar una linea al indicador, indicado el Volumen Maximo.. en modo VPOC.
Gracias Nicolas no te molestes.
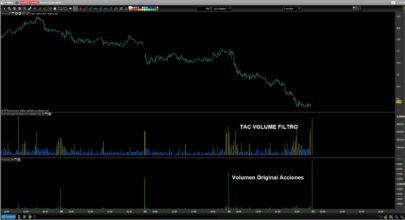
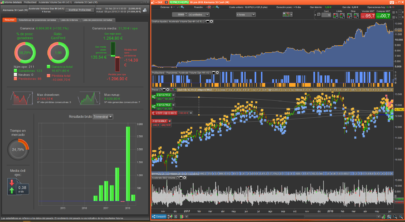
Ya he realizado mi propio indicador con un Volumen profile y un marker profile para el intradia para Prorealtime.
Como sabes todo mis indicadores están bloqueados pero te dejo el enlace por si te interesa probarlo y compartir ideas o mejoras…..
https://www.tiburonesdealetacorta.com/2018/11/tac-volumen-profile.html
Mucho de este indicador parte de tu idea inicial, solo se tenia que mejorar.
He publicado una nueva version para todos los valores
https://www.tiburonesdealetacorta.com/2018/11/tac-volumen-profile-v1.html
Gracias
Nicolas “podrías agregar una línea en el indicador, indicado el Volumen Máximo .. en modo VPOC”. como se pide por varios foreros y o no se puede hacer. ¿?.
Se puede hacer, por favor haga una solicitud específica en el foro, gracias.
Es esto lo que necesitas Nicolas
https://www.prorealcode.com/topic/bull-bear-volume-by-price-levels/
Si no dime como lo solicito..
Me puede indicar si esto es suficiente para realizar su colaboración.
Hi Nicolas,
Just a quick question:
> how come the “volume on price” indicator of PRT is so quick and this great one you developped so “slow”;
I makes no sens to me!
Thanks anyway for this;
Chris
ProBuilder is not Java.
😉 ok thanks
What about creating a strategy based on this indicator using the same trick you used in “swing lines : https://www.prorealcode.com/topic/swing-lines-strategy/“, registering the different maximimums of volume level which are a definition of a support or resistance?
Best,
Chris
no real trick, just storing each segment value into a variable.. 😉
BTW I tried to add a piece of code which makes the indicator automaticaly starts the “llokback” at the highest of the time frame but it did not work: here is what I tried (FYI the Add PRT code is down)
but it givest me an error saying the highest only accept positive integer (I debugged it but could not make it work)
…
for i=400 to barindex
StartVol=highest[400](high)
if high = StartVol then
StartBar = barindex
else
StartBar =0
endif
if StartBar > StartBar[1] then
LastStartBar = StartBar
endif
next
hh=highest[LastStartBar](high)
ll=lowest[LastStartBar](low)
div = (hh-ll)/NbrBars
i=0
volsum=summation[LastStartBar](volume)
while i=lrange and close[j]open[j] then
volbull=volbull+volume[j]
else
volbear=volbear+volume[j]
endif
endif
next
bullbar = round((volbull*LastStartBar)/volsum)*scalefactor
bearbar = round((volbear*LastStartBar)/volsum)*scalefactor
drawrectangle(LastStartBar,lrange,LastStartBar+bullbar,hrange) coloured(46,139,87,255)
drawrectangle(LastStartBar,lrange,LastStartBar+bearbar,hrange) coloured(255,0,0,255)
if bullbar>bearbar then
drawtext(“■”,LastStartBar+bullbar,(lrange+hrange)/2,Dialog,Bold,22) coloured(46,139,87)
else
drawtext(“■”,LastStartBar+bearbar,(lrange+hrange)/2,Dialog,Bold,22) coloured(255,0,0)
endif
i=i+1
wend
drawvline(barindex[LastStartBar])
return
Because your variable “LastStartBar” is sometimes equal to 0 or even negative, you should declare it in a way that it has a positive value in any case, like this:
LastStartBar = max(1,startbar)
thanks for your help
Hello Nicolas,
J’ai la même erreur avec ce code vous voyez d’ou cela vient ?
//PRC_Bull&Bear Volume on Price | indicator
//05.07.2018
//Nicolas @ http://www.prorealcode.com
//Sharing ProRealTime knowledge
//defparam drawonlastbaronly=true
//defparam calculateonlastbars=300
// — settings
//ScaleFactor = 5
//NbrBars=25
//lookback=50
// — end of settings
for i=0 to 400 do
StartVol=highest[400](high)
if high[i] = StartVol then
StartBar = i
//else
//StartBar =1
endif
if StartBar > StartBar[1] then
LastStartBar = max(1,startbar)
endif
next
hh=highest[LastStartBar](high)
ll=lowest[LastStartBar](low)
div = (hh-ll)/NbrBars
i=0
volsum=summation[LastStartBar](volume)
while i=lrange and close[j]open[j] then
volbull=volbull+volume[j]
else
volbear=volbear+volume[j]
endif
endif
next
bullbar = round((volbull*LastStartBar)/volsum)*scalefactor
bearbar = round((volbear*LastStartBar)/volsum)*scalefactor
drawrectangle(LastStartBar,lrange,LastStartBar+bullbar,hrange) coloured(46,139,87,255)
drawrectangle(LastStartBar,lrange,LastStartBar+bearbar,hrange) coloured(255,0,0,255)
if bullbar>bearbar then
drawtext(“■”,LastStartBar+bullbar,(lrange+hrange)/2,Dialog,Bold,22) coloured(46,139,87)
else
drawtext(“■”,LastStartBar+bearbar,(lrange+hrange)/2,Dialog,Bold,22) coloured(255,0,0)
endif
i=i+1
wend
drawvline(barindex[LastStartBar])
return
ça vient de la même erreur, on ne peut avoir 0 comme période dans un indicateur et LastStartBar doit être à 0 dans l’une des premières itérations du code.
Hello Nicolas,
C’est énigmatique pour moi ; pouvez-vous corriger le code ? Je pense que ce sera plus apprenant ; merci
Dans le code, il n’y a qu’à cet endroit ou tu déclares que LastStartBar doit être à minima égal à 1:
if StartBar > StartBar[1] then
LastStartBar = max(1,startbar)
endif
Hors si cette condition n’est pas vrai, LastStartBar est toujours égal à 0 à la première lecture du code, d’ou l’erreur générée par la plateforme. Je pense que tu devrais arriver à corriger cette petite erreur 🙂
J’ai essayé cela mais ça produit des traits verticaux
if StartBar > StartBar[1] then
LastStartBar = max(1,startbar)
else
LastStartBar = 1
endif
Hello Nicolas,
je bloque ;
je veux bien avoir votre correction de cet indicateur fonctionnant sur les plus hauts de derniers X unités ;
merci
Christophe
j’ai l’impression que ce code ne permet pas de connaitre le N° de la bougie correspondant au plus haut ;
StartVol=highest[400](high)
for j=0 to 4000 do
if high[j]=StartVol then
Start = j
break
//break//else
////StartBar =1
endif
next
celui-la
StartVol=highest[400](high)
for j=0 to 400 do
if high[j]=StartVol then
Start = j
break
//break//else
////StartBar =1
endif
next
Hello Nicolas,
Pour info tous les commentaires ont disparu !!!
il faut cliquer sur ‘older comments’.
‘older comments’ non visible pour moi ;
idem pour la barre supérieure ou l’on peut ‘souscrire’ et mettre en ‘favori’
pb reproduit sur edge
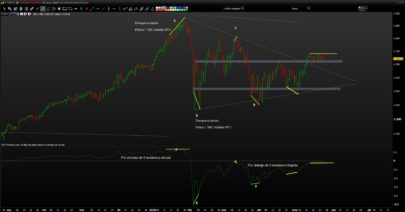
Hi, thanks for this, Nicolas. Quick question: can this be modified so that, for intraday timeframes, it displays the relevant volume at price levels at the start of each new trading day based on the last trading day, like here: https://images.app.goo.gl/cc3oRLoeUMcHDrrK6
I have seen Kris75’s variations on your work, but wanted to pose the question to you first. Thanks.
Hello, I would like to know if there is a screener compliant with this indicator (Bull & Bear Volume-by-Price levels) ?
Kind regards
I don’t think so, I can’t remember, but you can try to search in the forums.
Hello Nicolas,
This is just what I’ve been looking for, but I have a few questions:
1. Is it possible to increase the number of bars above 20? I tried 50 but I get a loop error.
2. Is it possible to do it on a set timeframe/session?
3. Is it possible to show previous days/sessions profiles?
Thanks for any help 🙂
1. yes
2. maybe yes?!
3. why not?
Bonjour Nicolas.
Je viens de découvrir cet indicateur, que je trouve bien intéressant
Mais j’ai un petit problème technique (peut-être lié à la version 11 de PRT ?).
Précision : j’ai importé la file *itf ci-dessus sans rien y changer.
Les rectangles ne sont pas colorés, et ils sont donc difficiles à voir sur le graphe (malheureusement, impossible ici d’ajouter une pièce jointe pour envoyer la copie d’écran).
As-tu idée d’où cela peut-il provenir ?
Merci par avance
Tu peux modifier le paramètre “scalefactor” pour adapter la hauteur des barres à ton graphique / écran.