Volume has to be the most underrated market variable used in technical analysis. But if you know how to analyze and interpret it, you’ll be able to see market turning points develop and anticipate pullbacks and trend changes.
You can figure out whether the Professionals are buying or selling by analyzing:
- Volume transacted at the bid or the ask
- High to low range of the bar, and
- Average trade size.
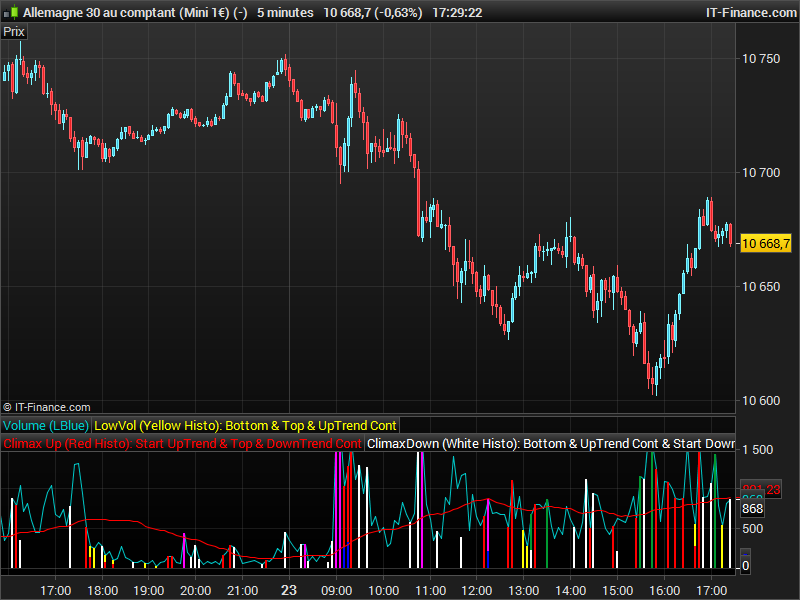
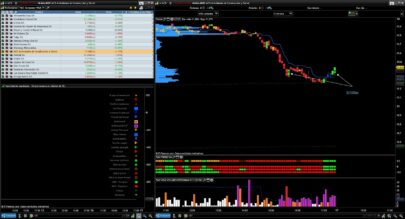
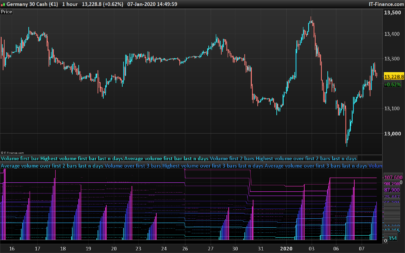
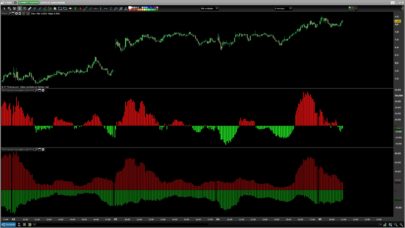
The Better Volume indicator improves on your typical volume histogram by coloring the bars based on 5 criteria:
- Volume Climax Up – high volume, high range, up bars (red)
- Volume Climax Down – high volume, high range, down bars (white)
- High Volume Churn – high volume, low range bars (green, PaintBar blue)
- Low Volume – low volume bars (yellow)
- Volume Climax plus High Volume Churn – both the above conditions (magenta)
When there are no volume signals the default histogram bar coloring is cyan. The Better Volume indicator also comes in a PaintBar version, so you can see the coloring on the price bars themselves.
original code and credits from (description taken from http://emini-watch.com/free-stuff/volume-indicator/)
Someone asked me to convert the Better Volume indicator recently, since I knew it were already made and available on the web, but not already in the Library, I decided to add it and in ITF file format for everyone’s convenience to download and import directly.
|
1 2 3 4 5 6 7 8 9 10 11 12 13 14 15 16 17 18 19 20 21 22 23 24 25 26 27 28 29 30 31 32 33 34 35 36 37 38 39 40 41 42 43 44 45 46 47 48 49 50 51 52 53 54 55 56 57 58 59 60 61 62 63 64 65 66 67 68 69 70 71 72 73 74 75 76 77 78 79 80 81 82 83 84 85 86 87 88 89 90 91 92 93 94 95 96 97 98 99 100 101 102 103 104 105 106 107 108 109 110 111 112 113 114 115 116 117 118 119 120 121 122 123 124 125 126 127 128 129 130 131 132 133 134 135 136 137 138 139 140 141 142 143 144 145 146 147 148 149 150 151 152 153 154 155 156 157 158 159 160 161 162 163 164 165 166 167 168 169 170 171 172 173 174 175 176 177 178 179 180 181 182 183 184 |
// Better Volume Indicator // Original idea by emini-watch.com // Source : http://emini-watch.com/free-stuff/volume-indicator/ AND http://emini-watch.com/category/volume-indicator/ // Rewrite for ProRealTime / ChartNet / CMC by Dutchy, march 2009 // Code is provided as public domain, no warranty. // You can find Dutchy on following fora // http://www.aktienboard.com/forum/f29/prorealtime-cmc-script-programmierung-t94783/ // http://www.pro-at.com/forums-bourse/sujet-Forums-Partenaires-Forum-ProRealTime-92.html // Peace // Better Volume Indicator - Summary // ClimaxUp (Red) : Top, Start Up Trend, Down Trend Continue // ClimaxDown (White): Bottom, Up Trend Continue, Start Down Trend // LowVolume (Yellow): Bottom, Top, Up Trend Continue // Churn (Green): Bottom, Top, Down Trend Continue // ClimaxChurn (Magenta): Top, Down Trend Continue // Parameter: History = Boolean // Parameter: Use2Bars = Boolean // Parameter: Lookback = 20 ONCE Condition1 = 0 ONCE Condition2 = 0 ONCE Condition3 = 0 ONCE Condition4 = 0 ONCE Condition5 = 0 ONCE Condition6 = 0 ONCE Condition7 = 0 ONCE Condition8 = 0 ONCE Condition9 = 0 ONCE Condition10 = 0 ONCE Condition11 = 0 ONCE Condition12 = 0 ONCE Condition13 = 0 ONCE Condition14 = 0 ONCE Condition15 = 0 ONCE Condition16 = 0 ONCE Condition17 = 0 ONCE Condition18 = 0 ONCE Condition19 = 0 ONCE Condition20 = 0 VolValue = Volume LowVolValue = VolValue ClimaxUpValue = VolValue ClimaxDownValue = VolValue ChurnValue = VolValue ClimaxChurnValue = VolValue StopVolValue = VolValue TrampolineValue = VolValue AVVolume = Average[Lookback*2](VolValue) IF History = 0 THEN BI = 400 ELSIF History = 1 THEN BI = Lookback ENDIF IF BARINDEX > BI AND Volume <> 0 THEN IF Close > Open THEN Value1 = Volume * (Range / (2 * Range + Open - Close)) ELSIF Close < Open THEN Value1= Volume * ((Range + Close - Open) / (2 * Range + Close - Open)) ENDIF IF Close = Open THEN Value1 = 0.5 * Volume ENDIF Value2 = Volume - Value1 Value3 = Value1 + Value2 Value4 = Value1 * Range Value5 = (Value1 - Value2) * Range Value6 = Value2 * Range Value7 = (Value2 - Value1) * Range IF Range <> 0 THEN Value8 = Value1 / Range Value9 = (Value1 - Value2) / Range Value10 = Value2 / Range Value11 = (Value2 - Value1) / Range Value12 = Value3 / Range ENDIF Value13 = Value3 +Value3[1] Value14 = (Value1+Value1[1]) * (Highest[2](High) - Lowest[2](Low)) Value15 = (Value1+Value1[1] - Value2 - Value2[1]) * (Highest[2](High) - Lowest[2](Low)) Value16 = (Value2 + Value2[1]) * (Highest[2](High) - Lowest[2](Low)) Value17 = (Value2 + Value2[1] - Value1 - Value1[1]) * (Highest[2](High) - Lowest[2](Low)) IF Highest[2](High) <> Lowest[2](Low) THEN Value18 = (Value1 + Value1[1]) / (Highest[2](High) - Lowest[2](Low)) ENDIF Value19 = (Value1 + Value1[1] - Value2 - Value2[1]) / (Highest[2](High) - Lowest[2](Low)) Value20 = (Value2 + Value2[1]) / (Highest[2](High) - Lowest[2](Low)) Value21 = (Value2 + Value2[1] - Value1 - Value1[1]) / (Highest[2](High) - Lowest[2](Low)) Value22 = Value13 / (Highest[2](High) - Lowest[2](Low)) IF Use2Bars = 0 THEN Condition1 = Value3 = Lowest[Lookback](Value3) Condition2 = Value4 = Highest[Lookback](Value4) AND Close > Open Condition3 = Value5 = Highest[Lookback](Value5) AND Close > Open Condition4 = Value6 = Highest[Lookback](Value6) AND Close < Open Condition5 = Value7 = Highest[Lookback](Value7) AND Close < Open Condition6 = Value8 = Lowest[Lookback](Value8) AND Close < Open Condition7 = Value9 = Lowest[Lookback](Value9) AND Close < Open Condition8 = Value10 = Lowest[Lookback](Value10) AND Close > Open Condition9 = Value11 = Lowest[Lookback](Value11) AND Close > Open Condition10 = Value12 = Highest[Lookback](Value12) ELSIF Use2Bars = 1 THEN Condition11 = Value13 = Lowest[Lookback](Value13) Condition12 = Value14 = Highest[Lookback](Value14) AND Close > Open AND Close[1] > Open[1] Condition13 = Value15 = Highest[Lookback](Value15) AND Close > Open AND Close[1] > Open[1] Condition14 = Value16 = Highest[Lookback](Value16) AND Close < Open AND Close[1] < Open[1] Condition15 = Value17 = Highest[Lookback](Value17) AND Close < Open AND Close[1] < Open[1] Condition16 = Value18 = Lowest[Lookback](Value18) AND Close < Open AND Close[1] < Open[1] Condition17 = Value19 = Lowest[Lookback](Value19) AND Close < Open AND Close[1] < Open[1] Condition18 = Value20 = Lowest[Lookback](Value20) AND Close > Open AND Close[1] > Open[1] Condition19 = Value21 = Lowest[Lookback](Value21) AND Close > Open AND Close[1] > Open[1] Condition20 = Value22 = Highest[Lookback](Value22) ENDIF // ********************************************************************************************* IF (Condition1 or Condition11) THEN // Yellow LowVol = LowVolValue ELSE LowVol = 0 ENDIF IF (Condition2 or Condition3 or Condition8 or Condition9 or Condition12 or Condition13 or Condition18 or Condition19) THEN // Red ClimaxUp = ClimaxUpValue IF LowVol <> 0 THEN ClimaxUp = ClimaxUpValue / 2 ENDIF ELSE ClimaxUp = 0 ENDIF IF (Condition4 or Condition5 or Condition6 or Condition7 or Condition14 or Condition15 or Condition16 or Condition17) THEN // White ClimaxDown = ClimaxDownValue IF LowVol <> 0 OR ClimaxUp <> 0 THEN ClimaxDown = ClimaxDownValue ENDIF ELSE ClimaxDown = 0 ENDIF IF (Condition10 or Condition20) THEN // Green Churn = ChurnValue IF LowVol <> 0 OR ClimaxUp <> 0 OR ClimaxDown <> 0 THEN Churn = ChurnValue / 2 ENDIF ELSE Churn = 0 ENDIF //IF (Condition10 or Condition20) AND (Condition2 or Condition3 or Condition4 or Condition5 or Condition6 or Condition7 or Condition8 or Condition9 or Condition12 or Condition13 or Condition14 or Condition15 or Condition16 or Condition17 or Condition18 or Condition19) THEN IF Churn <> 0 AND (ClimaxUp <> 0 OR ClimaxDown <> 0) THEN // Magenta ClimaxChurn = ClimaxChurnValue ELSE ClimaxChurn = 0 ENDIF //StopVolume LocalClosingPosition = 1 - (High - Close) / (High - Low) IF Volume > Volume[1] AND Range < Range[1] AND ((High > High[1] AND LocalClosingPosition < 0.4) OR (Low < Low[1] AND LocalClosingPosition > 0.6)) THEN StopVol = StopVolValue * 1 / 3 // HigherVolume & LowerRange @ HigherHigh or LowerLow - DBlue ELSE StopVol = 0 ENDIF //Trampoline FOR i = 1 TO 2 // Close together IF ((ClimaxChurn[i] > 0 OR ClimaxUp[i] > 0) AND (ClimaxChurn > 0 OR ClimaxUp > 0)) AND ((Close[i] > Open[i] AND Close < Open) OR (Close[i] < Open[i] AND Close > Open)) THEN Trampoline = TrampolineValue * 1 / 4 BREAK ELSE Trampoline = 0 ENDIF NEXT ENDIF RETURN Volume COLOURED (0, 200, 200) AS "Volume (LBlue)", LowVol COLOURED (255, 255, 0) AS "LowVol (Yellow Histo): Bottom & Top & UpTrend Cont",ClimaxUp COLOURED (255, 0, 0) AS "Climax Up (Red Histo): Start UpTrend & Top & DownTrend Cont", ClimaxDown COLOURED (255, 255, 255) AS "ClimaxDown (White Histo): Bottom & UpTrend Cont & Start Down Trend" , Churn COLOURED (0, 155, 50) AS "Churn = HighVol@LowRange (Green Histo): Bottom & Top & Down Trend Cont",ClimaxChurn COLOURED (255, 0, 255) AS "ClimaxChurn (Magenta Histo): Top & DownTrend Cont: Brearish", Trampoline COLOURED (0, 0, 255) AS "Trampoline (DBlue Histo): Reversal", StopVol COLOURED (0, 0, 0) AS "StopVol (Black Histo): Profit Taking", AVVolume COLOURED (255, 0, 0) AS "AVVolume (Red Line)" |
Share this
No information on this site is investment advice or a solicitation to buy or sell any financial instrument. Past performance is not indicative of future results. Trading may expose you to risk of loss greater than your deposits and is only suitable for experienced investors who have sufficient financial means to bear such risk.
ProRealTime ITF files and other attachments :
Find other exclusive trading pro-tools on ![]()
PRC is also on YouTube, subscribe to our channel for exclusive content and tutorials


Hi NicolasFirst thanks for your input here, learning so much, greatly appreciated.Using PRT 10.2 from IGI have imported the .itf file you produced however mine shows differently to the above, mine shows lines and not the very useful bars.Do you have any idea what I have done wrong or how to fix?And secondly has a ‘paint’ better volume version for PRT been done, if so is there a .itf file?Thankyou appreciatedRichard
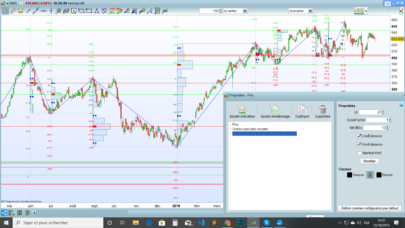
In the indicator’s parameter window, set all returned values to “histogram” instead of lines, except the ones labelled ‘Volume’ and ‘AVVolume’.
Thanks but … below is the code and image link is the output, appears as lines see: https://drive.google.com/open?id=0B0H_fMLHsA9YSW1yMVUwYjE2VXc Please adviseThanksRichard
Richard, please follow the instructions I gave you on your last comment: set values to histogram, not lines! I can’t do it for you! 🙂
Went through all the code and the word “lines” does not appear anywhere however “histo” appears 7 times so clearly something is wrong?https://drive.google.com/open?id=0B0H_fMLHsA9YQjlzRVU4OEVaY3M
Please click on the wrench on the upper left side of the indicator window, a new window will appear and you’ll find there how to modify returned values of the indicator.
so what am I missing? https://drive.google.com/open?id=0B0H_fMLHsA9YMUswZ0tKbmlvdm8
Nicolas, Maybe you missed my last response.Do you know why your code does not produce the same result (image) as above? As it is clearly not “histo” in the code because “histo” is there.Thanks
The answer is the same as the previous one. Don’t touch anything in the code and use the parameter window instead, please click on the wrench!
HiThanks finally got it … Click on wrench then in the Better Volume selection click on e.g. Low Volume and then right hand column Style from drop down select histogram.Thanks again, apologies for the inconvenience … learning
Bonjour Nicolas,
J’ai un pb lorsque je remplace “Use2Bars” par “Boolean” comme préconisé ds les Paramètres. Cela me demande ensuite de définir”Boolean”!!!
Que fais-je de travers???
Merci
Une variable “booléenne” est une variable vrai/faux, soit égale à 1 ou 0.
Merci de votre réponse! Cpdt je reste dans le floue! Que dois-je mettre à la place de “History”et de “Use2Bars” qui ne soit déjà dans l’écriture du code???
Un 1 (=vrai) ou un 0 (=faux). Le plus simple reste de télécharger le fichier de l’indicateur et de l’importer directement dans la plateforme ! 🙂
Je ne désespère pas qu’on arrive à se comprendre 😉
Pour le code, je ne le recopie pas à la main… non!!! 🙂
Je copie-colle sur la plateforme et voici ce que cela me marque(pièce jointe) lorsque je VALIDE pour fermer la fenêtre Probuilder.
Alors pour “Lookback” je remplace par “20” partout où il y a écrit “Lookback”! Mais pour “History” et “Use2Bars” si j’écris “Boolean” à la place ! Cela me dit de définir “Boolean”…
Je ne doute pas une seconde que mes questions doivent vous paraître stupide…:) Mais vous l’aurez compris je n’y connais strictement rien en programmation.
Merci de me venir en aide 😉 Help
PS : Pièce Jointe sur votre mail Ici impossible de coller le lien
C’est bon j’ai réussi…Merci qd même 😉
Bonjour,
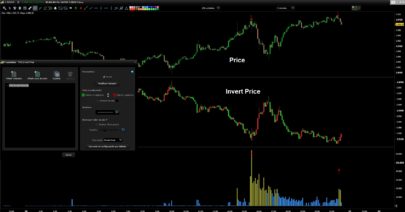
Existe t’il une version de cet indicateur que l’on puisse afficher directement sur un graphique en Bar Chart???
L’indicateur doit également s’afficher de la même manière pour un graphique en barchart ou en chandelier japonais.
Re-
Cela fonctionne pour vous?! Car j’ai beau passer par la fenêtre”Prix” et sélectionner l’indicateur que cela soit en Chandelier ou Barchart et rien ne se passe!
Bonjour Nicolas…
Auriez-vous une solution, alors! Pour afficher directement sur le graphique???
Bien sûr, il ne faut pas appliquer l’indicateur sur le prix… mais utiliser le bouton “indicateurs et systèmes de trading”. Ensuite il faut bien entendu que l’instrument ait du Volume !
Décidément on a tjrs un peu de mal à se comprendre;)! Le concepteur de cet indicateur, a créé une double fonctionnalité!!! La première (afficher l’indicateur sous forme d’histogramme sous la fenêtre de prix),la seconde (afficher l’indicateur directement sur le graphique du prix en colorant directement les chandeliers)…Ma question portait donc sur le fait de savoir si le code présent ici même(au-dessus) permettait aussi d’avoir les deux fonctionnalités, ou seulement une seule avec une fenêtre sous le prix en histogramme?!
– http://emini-watch.com/free-stuff/volume-indicator/
Je comprends mais ça n’est pas le cas pour cette version prorealtime désolé.
Ok Merci pour la réponse!!!
On est enfin arrivé à se comprendre 😉 Ma première formulation, n’était peut être pas très claire…
Merci bonne soirée
Hallo Nicolas. Great version of Better Volume. I was using B.V. with Ninjatrader but Prorealtime is more comfortable and better quality of volume data.
Can you make code ”Better Xtrend” for Prorealtime, please? It’s good stuff for supply and demand . Works well with B.V. I would be very grateful.
Sure, please open a request in the probuilder forum, with screenshots of the indicator and code to translate, if possible, thank you.
Thank you Nicolas. Done : https://www.prorealcode.com/topic/better-x-trend-indicator-nt-78-conversion-to-prorealtime/
Hi Nicolas,
I’m getting the error : ” The following variable is undefined: lookback, history, use2bars .
Could you help me out ?
Just add these 3 lines at the beginning of the code: (or download the ITF file and import it into your platform)
History = 1
Use2Bars = 1
Lookback = 20
Thanks Nicolas,
I would like to change the colors i.e from red to green histogram for climaxup. Also, would like to remove the cyan histogram bar as it does not make much sense to me , could not understand what it represents.
Cheers
Salve Nicolas, grazie per il tuo contributo, l’indicatore funziona davvero bene, ha un’ottima percentuale di affidabilità. Vorrei chiederti se puoi dare qualche informazione più dettagliata sul significato delle barre, alcune sono chiare per me, ad esempio istogramma rosso = volumi acquisto in aumento, istogramma bianco=volumi di vendita in aumento. Non sono sicuro invece di aver compreso cosa indica l’istogramma magenta e verde, se puoi essere così cortese di darmi qualche informazione in più. Grazie per la tua risposta. Cordialità.
Hi Nicolas realise that this may not be the place however I’m trying to get the above indicator converted into Javascript for my Futures platform, are you able to assist or point me in the direction of someone that can?
For private paid coding assistance, you can contact me via this page: https://www.prorealcode.com/trading-programming-services/
Hello
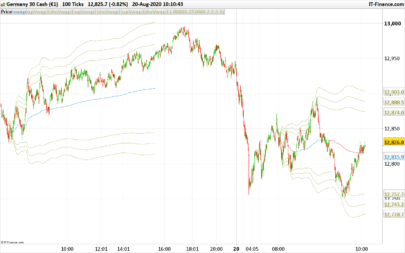
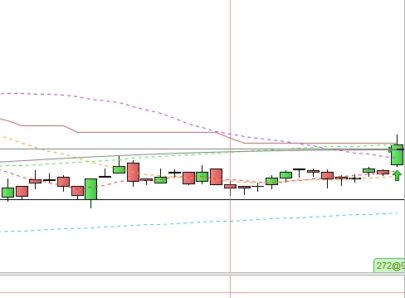
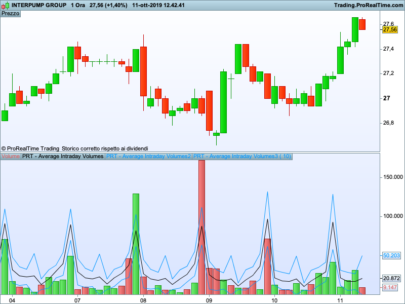
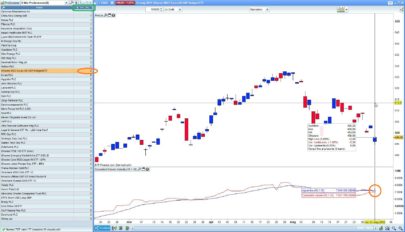
can you tell me if the .itf file is indeed compatible with prorealtime v11 ? Because all i see is vertical colored thin lines on the ”’price” chart.
here is a picture of default display settings of PRT 11
also the page https://emini-watch.com/free-stuff/volume-indicator/ was updates in winter 2020 but i dk what changed.
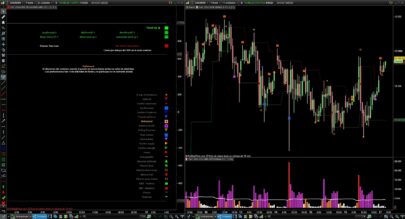
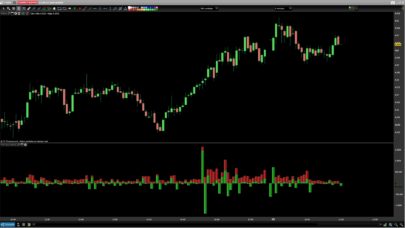
Don’t add it on the price, but like an oscillator in a separated window instead.
picture is here
https://i.imgur.com/GQEpYER.png
Hello Nicolas; not sure to undersntad line 167, and in the video I d’ont remember that the author speak about this particular point. Could you please indicate what the StopVol means from your point of view ? Thank you very much
I don’t know, this code is 6 years old and I made a 1:1 translation of the provided code by another member.
https://emini-watch.com/free-stuff/volume-indicator/