

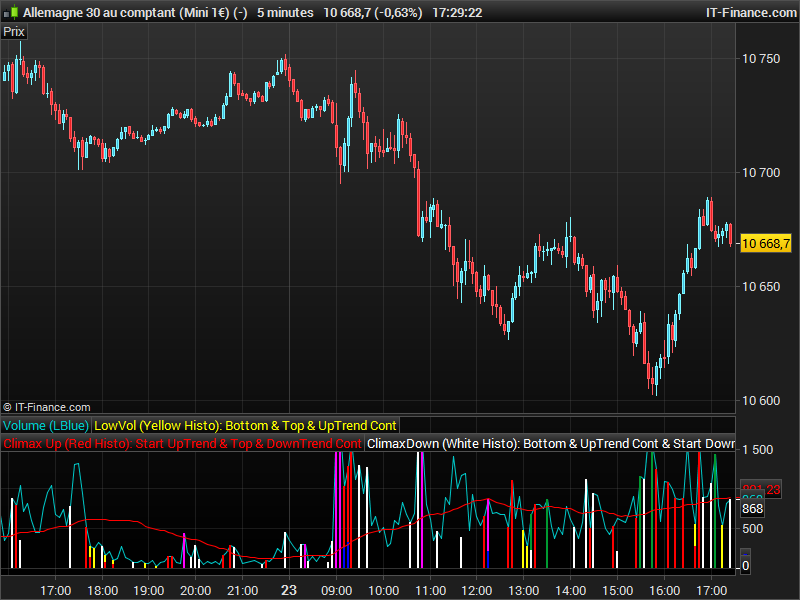
Better Volume
Volume has to be the most underrated market variable used in technical analysis. But if you know how to analyze and interpret it, you’ll be able to see market turning points develop and anticipate pullbacks and trend changes.
You can figure out whether the Professionals are buying or selling by analyzing:
- Volume transacted at the bid or the ask
- High to low range of the bar, and
- Average trade size.
The Better Volume indicator improves on your typical volume histogram by coloring the bars based on 5 criteria:
- Volume Climax Up – high volume, high range, up bars (red)
- Volume Climax Down – high volume, high range, down bars (white)
- High Volume Churn – high volume, low range bars (green, PaintBar blue)
- Low Volume – low volume bars (yellow)
- Volume Climax plus High Volume Churn – both the above conditions (magenta)
When there are no volume signals the default histogram bar coloring is cyan. The Better Volume indicator also comes in a PaintBar version, so you can see the coloring on the price bars themselves.
original code and credits from (description taken from http://emini-watch.com/free-stuff/volume-indicator/)
Someone asked me to convert the Better Volume indicator recently, since I knew it were already made and available on the web, but not already in the Library, I decided to add it and in ITF file format for everyone’s convenience to download and import directly.
// Better Volume Indicator
// Original idea by emini-watch.com
// Source : http://emini-watch.com/free-stuff/volume-indicator/ AND http://emini-watch.com/category/volume-indicator/

// Rewrite for ProRealTime / ChartNet / CMC by Dutchy, march 2009
// Code is provided as public domain, no warranty.
// You can find Dutchy on following fora
// http://www.aktienboard.com/forum/f29/prorealtime-cmc-script-programmierung-t94783/
// http://www.pro-at.com/forums-bourse/sujet-Forums-Partenaires-Forum-ProRealTime-92.html
// Peace

// Better Volume Indicator - Summary
// ClimaxUp (Red) : Top, Start Up Trend, Down Trend Continue
// ClimaxDown (White): Bottom, Up Trend Continue, Start Down Trend
// LowVolume (Yellow): Bottom, Top, Up Trend Continue
// Churn (Green): Bottom, Top, Down Trend Continue
// ClimaxChurn (Magenta): Top, Down Trend Continue

// Parameter: History = Boolean
// Parameter: Use2Bars = Boolean
// Parameter: Lookback = 20

ONCE Condition1 = 0
ONCE Condition2 = 0
ONCE Condition3 = 0
ONCE Condition4 = 0
ONCE Condition5 = 0
ONCE Condition6 = 0
ONCE Condition7 = 0
ONCE Condition8 = 0
ONCE Condition9 = 0
ONCE Condition10 = 0
ONCE Condition11 = 0
ONCE Condition12 = 0
ONCE Condition13 = 0
ONCE Condition14 = 0
ONCE Condition15 = 0
ONCE Condition16 = 0
ONCE Condition17 = 0
ONCE Condition18 = 0
ONCE Condition19 = 0
ONCE Condition20 = 0

VolValue = Volume
LowVolValue = VolValue
ClimaxUpValue = VolValue
ClimaxDownValue = VolValue
ChurnValue = VolValue
ClimaxChurnValue = VolValue
StopVolValue = VolValue
TrampolineValue = VolValue
AVVolume = Average[Lookback*2](VolValue)

IF History = 0 THEN
    BI = 400
ELSIF History = 1 THEN
    BI = Lookback
ENDIF

IF BARINDEX > BI AND Volume <> 0 THEN

    IF Close > Open THEN
        Value1 = Volume * (Range / (2 * Range + Open - Close))
    ELSIF Close < Open THEN
        Value1= Volume * ((Range + Close - Open) / (2 * Range + Close - Open))
    ENDIF
    IF Close = Open THEN
        Value1 = 0.5 * Volume
    ENDIF
    Value2 = Volume  - Value1

    Value3 = Value1 + Value2
    Value4 = Value1 * Range
    Value5 = (Value1 - Value2) * Range
    Value6 = Value2 * Range
    Value7 = (Value2 - Value1) * Range
    IF Range <> 0 THEN
        Value8 = Value1 / Range
        Value9 = (Value1 - Value2) / Range
        Value10 = Value2 / Range
        Value11 = (Value2 - Value1) / Range
        Value12 = Value3 / Range
    ENDIF

    Value13 = Value3 +Value3[1]
    Value14 = (Value1+Value1[1]) * (Highest[2](High) - Lowest[2](Low))
    Value15 = (Value1+Value1[1] - Value2 - Value2[1]) * (Highest[2](High) - Lowest[2](Low))
    Value16 = (Value2 + Value2[1]) * (Highest[2](High) - Lowest[2](Low))
    Value17 = (Value2 + Value2[1] - Value1 - Value1[1]) * (Highest[2](High) - Lowest[2](Low))
    IF Highest[2](High) <> Lowest[2](Low) THEN
        Value18 = (Value1 + Value1[1]) / (Highest[2](High) - Lowest[2](Low))
    ENDIF
    Value19 = (Value1 + Value1[1] - Value2 - Value2[1]) / (Highest[2](High) - Lowest[2](Low))
    Value20 = (Value2 + Value2[1]) / (Highest[2](High) - Lowest[2](Low))
    Value21 = (Value2 + Value2[1] - Value1 - Value1[1]) / (Highest[2](High) - Lowest[2](Low))
    Value22 = Value13 / (Highest[2](High) - Lowest[2](Low))

    IF Use2Bars = 0 THEN
        Condition1 = Value3 = Lowest[Lookback](Value3)
        Condition2 = Value4 = Highest[Lookback](Value4) AND Close > Open
        Condition3 = Value5 = Highest[Lookback](Value5) AND Close > Open
        Condition4 = Value6 = Highest[Lookback](Value6) AND Close < Open
        Condition5 = Value7 = Highest[Lookback](Value7) AND Close < Open
        Condition6 = Value8 = Lowest[Lookback](Value8) AND Close < Open
        Condition7 = Value9 = Lowest[Lookback](Value9) AND Close < Open
        Condition8 = Value10 = Lowest[Lookback](Value10) AND Close > Open
        Condition9 = Value11 = Lowest[Lookback](Value11) AND Close > Open
        Condition10 = Value12 = Highest[Lookback](Value12)
    ELSIF Use2Bars = 1 THEN
        Condition11 = Value13 = Lowest[Lookback](Value13)
        Condition12 = Value14 = Highest[Lookback](Value14) AND Close > Open AND Close[1] > Open[1]
        Condition13 = Value15 = Highest[Lookback](Value15) AND Close > Open AND Close[1] > Open[1]
        Condition14 = Value16 = Highest[Lookback](Value16) AND Close < Open AND Close[1] < Open[1]
        Condition15 = Value17 = Highest[Lookback](Value17) AND Close < Open AND Close[1] < Open[1]
        Condition16 = Value18 = Lowest[Lookback](Value18) AND Close < Open AND Close[1] < Open[1]
        Condition17 = Value19 = Lowest[Lookback](Value19) AND Close < Open AND Close[1] < Open[1]
        Condition18 = Value20 = Lowest[Lookback](Value20) AND Close > Open AND Close[1] > Open[1]
        Condition19 = Value21 = Lowest[Lookback](Value21) AND Close > Open AND Close[1] > Open[1]
        Condition20 = Value22 = Highest[Lookback](Value22)
    ENDIF

    // *********************************************************************************************

    IF (Condition1 or Condition11) THEN    // Yellow
        LowVol = LowVolValue
    ELSE
        LowVol = 0
    ENDIF

    IF (Condition2 or Condition3 or Condition8 or Condition9 or Condition12 or Condition13 or Condition18 or Condition19) THEN        // Red
        ClimaxUp = ClimaxUpValue
        IF LowVol <> 0 THEN
            ClimaxUp = ClimaxUpValue / 2
        ENDIF
    ELSE
        ClimaxUp = 0
    ENDIF

    IF (Condition4 or Condition5 or Condition6 or Condition7 or Condition14 or Condition15 or Condition16 or Condition17) THEN        // White
        ClimaxDown = ClimaxDownValue
        IF LowVol <> 0 OR ClimaxUp <> 0 THEN
            ClimaxDown = ClimaxDownValue
        ENDIF
    ELSE
        ClimaxDown = 0
    ENDIF

    IF (Condition10 or Condition20) THEN    // Green
        Churn = ChurnValue
        IF LowVol <> 0 OR ClimaxUp <> 0 OR ClimaxDown <> 0 THEN
            Churn = ChurnValue / 2
        ENDIF
    ELSE
        Churn = 0
    ENDIF

    //IF (Condition10 or Condition20) AND (Condition2 or Condition3 or Condition4 or Condition5 or Condition6 or Condition7 or Condition8 or Condition9 or Condition12 or Condition13 or Condition14 or Condition15 or Condition16 or Condition17 or Condition18 or Condition19) THEN
    IF Churn <> 0 AND (ClimaxUp <> 0 OR ClimaxDown <> 0) THEN        // Magenta
        ClimaxChurn = ClimaxChurnValue
    ELSE
        ClimaxChurn = 0
    ENDIF

    //StopVolume
    LocalClosingPosition = 1 - (High - Close) / (High - Low)
    IF Volume > Volume[1] AND Range < Range[1] AND ((High > High[1] AND LocalClosingPosition < 0.4) OR (Low < Low[1] AND LocalClosingPosition > 0.6)) THEN
        StopVol = StopVolValue    * 1 / 3     // HigherVolume & LowerRange @ HigherHigh or LowerLow - DBlue
    ELSE
        StopVol = 0
    ENDIF

    //Trampoline
    FOR i = 1 TO 2        // Close together
        IF ((ClimaxChurn[i] > 0 OR ClimaxUp[i] > 0) AND (ClimaxChurn > 0 OR ClimaxUp > 0)) AND ((Close[i] > Open[i] AND Close < Open) OR (Close[i] < Open[i] AND Close > Open)) THEN
            Trampoline = TrampolineValue * 1 / 4
            BREAK
        ELSE
            Trampoline = 0
        ENDIF
    NEXT

ENDIF

RETURN Volume COLOURED (0, 200, 200) AS "Volume (LBlue)", LowVol COLOURED (255, 255, 0) AS "LowVol (Yellow Histo): Bottom & Top & UpTrend Cont",ClimaxUp COLOURED (255, 0, 0) AS "Climax Up (Red Histo): Start UpTrend & Top & DownTrend Cont", ClimaxDown COLOURED (255, 255, 255) AS "ClimaxDown (White Histo): Bottom & UpTrend Cont & Start Down Trend" , Churn  COLOURED (0, 155, 50) AS "Churn = HighVol@LowRange (Green Histo): Bottom & Top & Down Trend Cont",ClimaxChurn COLOURED (255, 0, 255) AS "ClimaxChurn (Magenta Histo): Top & DownTrend Cont: Brearish", Trampoline COLOURED (0, 0, 255) AS "Trampoline (DBlue Histo): Reversal", StopVol COLOURED (0, 0, 0) AS "StopVol (Black Histo): Profit Taking", AVVolume COLOURED (255, 0, 0) AS "AVVolume (Red Line)"