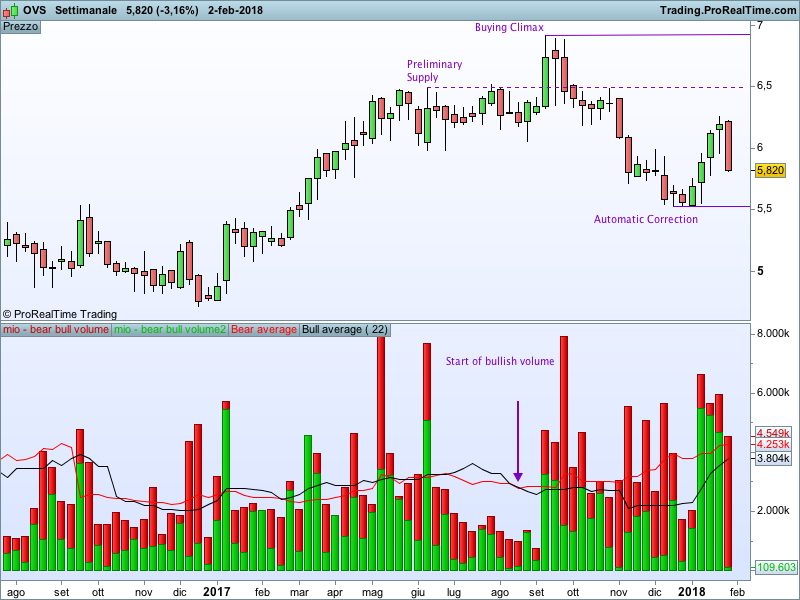
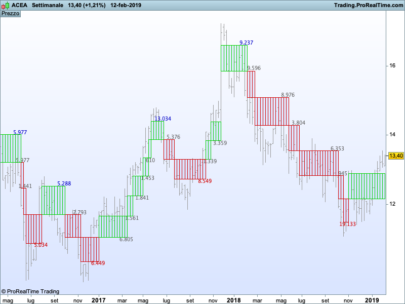
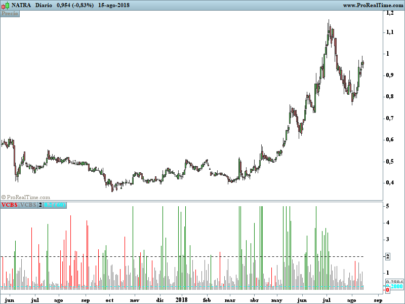
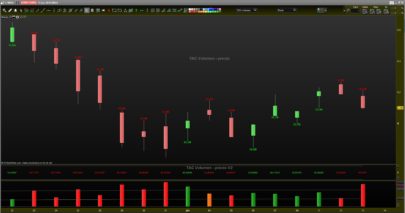
This code is mainly for Wyckoffians and can be used in accumulation/distribution phases to spot the change of forces.
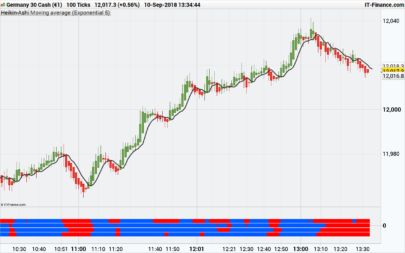
The volume bars are showing who is stronger in the period defined in the timeframe (more green means that bulls are running the show, in this case, in the weekly period).
The moving averages are showing the same information but based on an historical point of view (when the bull line crosses over the bear line bulls are becoming stronger in the longer period).
I suggest to use a period of 22 or more and always based on the timeframe in use.
Blue skies!!
|
1 2 3 4 5 6 7 8 9 10 11 12 13 14 15 16 17 18 19 20 |
ref=(close-low)/range volbull=ref*volume volbear=volume if close>=open then greenbarcount=1 greenvolume=volume redbarcount=0 redvolume=0 else greenbarcount=0 greenvolume=0 redbarcount=1 redvolume=volume endif //media volumi rossi e verdi per media mobile semplice mmred=summation[period](redvolume)/summation[period](redbarcount) mmgreen=summation[period](greenvolume)/summation[period](greenbarcount) return volbear coloured (205,0,0) style (histogram), volbull coloured (0,190,0) style (histogram), mmred coloured (255,0,0) as "Bear average",mmgreen as "Bull average" |
Share this
No information on this site is investment advice or a solicitation to buy or sell any financial instrument. Past performance is not indicative of future results. Trading may expose you to risk of loss greater than your deposits and is only suitable for experienced investors who have sufficient financial means to bear such risk.
ProRealTime ITF files and other attachments :
Find other exclusive trading pro-tools on ![]()
PRC is also on YouTube, subscribe to our channel for exclusive content and tutorials


very interesting, thank you gabri
Bonjour a tous,
Au vu de la disparite des histogramme ne peut-on pas ramener cet indicateur sur une echelle de 0 a 100
pour avoir une idee plus precise de l evolution des bulls and bears
¡ Nicolas devrait pouvoir nous le faire ! ?
Bonjour
manque de temps ou impossible de ramener cet indicateur sur une echelle de 0 à 100 ?
//stocperiod= period of choice
a=mmred-mmgreen
alto=highest[stocperiod](a)
basso=lowest[stocperiod](a)
sto=100*(a-basso0/(alto-basso)
return sto
Bear and Bull Volume %
//stocperiod= period of choice
a=mmred-mmgreen
alto=highest[stocperiod](a)
basso=lowest[stocperiod](a)
sto=100*(a-basso/(alto-basso))
return sto
Buonasera Gabri apparentemente codifica come non funziona ?!
stocperiod = 50
period=22
if close>=open then
greenbarcount=1
greenvolume=volume
redbarcount=0
redvolume=0
else
greenbarcount=0
greenvolume=0
redbarcount=1
redvolume=volume
endif
//media volumi rossi e verdi per media mobile semplice
mmred=summation[period](redvolume)/summation[period](redbarcount)
mmgreen=summation[period](greenvolume)/summation[period](greenbarcount)
stocperiod= 100
a=mmgreen-mmred
alto=highest[stocperiod](a)
basso=lowest[stocperiod](a)
sto=100*(a-basso)/(alto-basso)
return sto
Prorealcode sometimes cuts the codes, I hope it works now
Hello Gabri
This is not what I would like because we do not distinguish the strength of red and green histograms (their junction reported on a scale of 0 to 100 showing us the trend)
the idea is to induce the trend by the biased volumes of the indicator.
thank you for your support
have a good day
I am not sure I understand what you mean.
https://www.prorealcode.com/topic/volume-bear-bull-gabri-100/
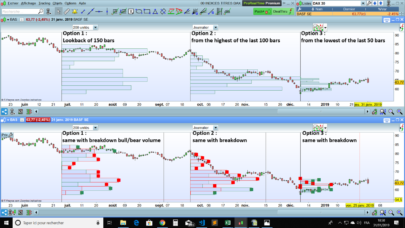
Hello Gabri ,
From this indicator can we have a screener that highlights the histograms entirely red in the last x periods.
thanks for your help
Do you want a screener or a code to highlight bars? I don’t understand
I want a screener please
I don’t think you will never find an histogram completely red…if that’s what you mean.
Yes yes there are many completely red histograms, it is to set up a strategy.
period=11
lookback=10
if close>=open then
greenbarcount=1
greenvolume=volume
redbarcount=0
redvolume=0
else
greenbarcount=0
greenvolume=0
redbarcount=1
redvolume=volume
endif
mmred=summation[period](redvolume)/summation[period](redbarcount)
mmgreen=summation[period](greenvolume)/summation[period](greenbarcount)
onlyred=mmgreen=0
c2=summation[lookback](onlyred)
SCREENER [c2] (mmred as “res”)
Hello Gabri
The code as it does not work, I tested it in different markets and countries daily. I also changed the value of lookback to 1 to test, I will only like the results on the last day side.
good Sunday
When I run the screener I found only starbucks on the italian market matching the criteria and no stocks on the us market. As I told you I am not sure you can get many all-red bars. Lowering the period (not the lookback value) might help but this will not be a useful result. When I created this code I did it with the idea to help people using the Wyckoff techniques…and this has nothing to do with automatic trading or screening of stocks.
I recently read “the method Wyckoff” by Enrique Diaz Valdecantos, and I found interesting leads following his explanations on volumes.
Your volume indicator comes very well in support of the book.
I like you Starbucks in return.
To isolate the days when the volumes are 100% negative would have helped me to develop my observations, a pity.
thank you for your help cordially
Purtroppo su versione 10.2 non funziona….mi stavo cominciando a documentare su Wyckoff!! qualcuno ha modificato x versione 10.2 PRT ??? Grazie
Che errore riporta?
Errore nell’indicatore: PRC_CandlesticksPatterns
Errore di sintassi: Linea 12, carattere 9 Uno dei seguenti caratteri sarebbe più appropriato di “(“:
– “,”
– “=”
https://ibb.co/izCTCx
al link trovi screen shot…non sono riuscito a postare immagine. GRAZIE MILLE
Se hai copiato e incollato il codice che ho scritto non dovresti avere quel messaggio. Alla riga 12 non ci sono parentesi da generare errori. Riesci a copiare e incollare la tua riga 12?
scusami se ti scrivo solo ora, ma non mi arrivano le notifiche e pensavo non mi avessi risposto.
Comunque io ho importato il file *.itf e non ho copiato il codice.
Essendo nuovo del forum ti dispiacerebbe farmi capire quale copiare ed incollare? quello in alto o quello in qualche post che avete discusso?
Grazie mille
scusami non appena sono a casa ti posto la riga 12 (ma non è altro che quella del file itf. Rigrazie
https://ibb.co/hpjcuc
LINEA 20 CARATTERE 35 ….. link sopra con screenshot. Grazie mille
Cambia la riga cosi’:
return volbear coloured (205,0,0) , volbull coloured (0,190,0) , mmred coloured (255,0,0) as “Bear average”,mmgreen as “Bull average”
non verra’ visualizzato un istogramma ma una linea normale
Hi Gabri,
I am trying to set a simple strategy based on your very cool indicator
Here are the conditions:
BUY = ENTRY :
if the bull-volume-green-bar CROSSES (i.e is superior) the simple moving average of the past 23 bull-volumes
if the bull-volume-green-bar CROSSES (i.e is superior) the simple moving average of the past 23 bear-volumes
SELL = EXIT:
if the bear-volume-green-bar CROSSES the simple moving average of the past 23 bull-volumes
if the bear-volume-green-bar CROSSES the simple moving average of the past 23 bear-volumes
I tried to use the automatic coding system but it does not work; I tried also to code it myself using moving average but it is not working either.
Can you help me on this?
Thanks !
Chris
Kris, I will answer on the forum at the following address https://www.prorealcode.com/topic/strategie-sur-bull-bear-volumes/#post-66030.
Give me a few days since I am in the process of moving.
Hi Guys,
Will it be possible to add “Texts” to this code. When the bull line crosses over the bear line I would like to insert a “BULL” text on the:
1.Corresponding volume bar or histogram on this indicator
2.On the corresponding Price candle. I would like the “Bull” text to appear just above the candle stick.
3.Vice versa for when the bear line crosses the bull line.
Regards,
Segie
Segie, I can add text on the graph of THIS indicator. To add text ALSO on the price graph you need to do another code and everytime you change the settings on the bear bull volume indicator you need to change the settings also on the second one….you might end up having not the same info and this is not good in my opinion.
bro volume indicator works on mt 4 ?
This indicator is for ProRealTime (PRT), you can ask for private job on this page: https://www.prorealcode.com/trading-programming-services/
hello, im getting an error when i paste in the code…
return volbear coloured (205,0,0) style (histogram), volbull coloured (0,190,0) style (histogram), mmred coloured (255,0,0) as “Bear average”,mmgreen as “Bull average”
this is the issue, please can you adise me on this
many thanks
This code should work for all prorealtime trading platform v10.3 onwards.
when pasted into the indicator area it says THE FOLLOWING VARIABLE IS UNDEFINED:PERIOD any idea why?
ref=(close-low)/range
volbull=ref*volume
volbear=volume
if close>=open then
greenbarcount=1
greenvolume=volume
redbarcount=0
redvolume=0
else
greenbarcount=0
greenvolume=0
redbarcount=1
redvolume=volume
endif
//media volumi rossi e verdi per media mobile semplice
mmred=summation[period](redvolume)/summation[period](redbarcount)
mmgreen=summation[period](greenvolume)/summation[period](greenbarcount)
return volbear coloured (205,0,0) style (histogram), volbull coloured (0,190,0) style (histogram), mmred coloured (255,0,0) as “Bear average”,mmgreen as “Bull average”
yes, because it is not defined in the code. I would recommend to download the itf file and import it into your platform to get all the extern variables.
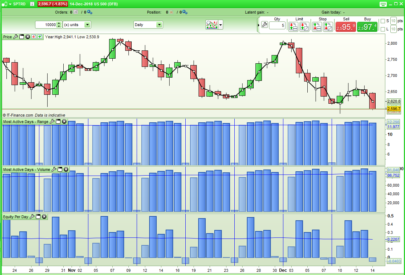
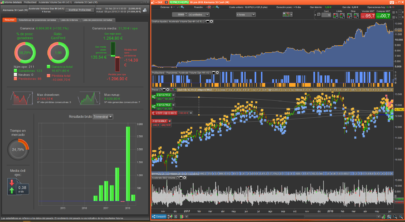
Very useful indicator! Great! just a question. According to you is it possible to create a double Accumulation-Distribution indicator, with two lines? one for buy volume and one for sell volume. Thanks for your feedback. M
Hi, this would be the idea behind.
What I mean is not a bear/bull Average as integrated in the indicator but a new Accumulation-Distribution Indicator able to splitted the buy volume and the sell volume. It means AD buy line + AD sell line. Ho fatto una simulazione in Excel con 3 linee (AD/ADbuy/ADsell). Thanks M
Si, dovrebbe essere un accumulation/distribution indicator in grado di dirti quando il mercato diventa bull o bear
Ciao Gabry, provo a spiegarmi meglio in italiano. Innanzitutto complimenti per l´indicatore. Trovo che la suddivisione che hai fatto tra i volumi in buy e i volumi in sell sia la parte + geniale. Abbinato ai volumi Buy/sell utilizzo l´indicatore Accumulation-Distribution (indicatore di default). L´indicatore classico AD tuttavia, nel calcolo considera i volumi totali per ogni barra senza scindere quelli in buy o in sell. Io ho fatto una simulazione in Excel (non so come condividertela) dove oltre all´AD classico ci sono AD buy e Ad sell. Io non sono un programmatore, ma vedo che tu sei molto bravo. Saresti in grado eventualmente di programmare questo nuovo indicatore con 3 linee AD/AD buy/AD sell? Grazie per il supporto. Un saluto Marco
Ciao, ora ho capito. Devi aggiungere le seguenti righe:
riga 4:
ADvolbull = volbull
ADvolbear = volume – ADvolbull
riga 5:
BullAD = sum[ADvolbull*((Close-Low) – (High-Close)) / (High-Low)]
BearAD = sum[ADvolbear*((Close-Low) – (High-Close)) / (High-Low)]
alla fine dell’istruzione return aggiungi una virgola e poi il seguente testo:
BullAD as “AD volume Bull”, BearAD as “AD volume Bear”
la visualizzazione potrebbe diventare un problema a causa delle scale, disattiva magari quali linee non vedere dalla finestra principale
Ho provato in questo modo ma da errore:
ref=(close-low)/range
volbull=ref*volume
volbear=volume
ADvolbull = volbull
ADvolbear = volume – ADvolbull
BullAD = sum[ADvolbull*((Close-Low) – (High-Close)) / (High-Low)]
BearAD = sum[ADvolbear*((Close-Low) – (High-Close)) / (High-Low)]
Return BullAD as “AD volume Bull”, BearAD as “AD volume Bear”
if close>=open then
greenbarcount=1
greenvolume=volume
redbarcount=0
redvolume=0
else
greenbarcount=0
greenvolume=0
redbarcount=1
redvolume=volume
endif
//media volumi rossi e verdi per media mobile semplice
mmred=summation[period](redvolume)/summation[period](redbarcount)
mmgreen=summation[period](greenvolume)/summation[period](greenbarcount)
return volbear coloured (205,0,0) style (histogram), volbull coloured (0,190,0) style (histogram), mmred coloured (255,0,0) as “Bear average”,mmgreen as “Bull average”
che errore da?
ho capito….. hai aggiunto due istruzioni return. Avevo detto qualcosa di differente io
alla fine dell’istruzione return aggiungi una virgola e poi il seguente testo:
BullAD as “AD volume Bull”, BearAD as “AD volume Bear”
ref=(close-low)/range
volbull=ref*volume
volbear=volume
ADvolbull = volbull
ADvolbear = volume – ADvolbull
BullAD = sum[ADvolbull*((Close-Low) – (High-Close)) / (High-Low)]
BearAD = sum[ADvolbear*((Close-Low) – (High-Close)) / (High-Low)]
if close>=open then
greenbarcount=1
greenvolume=volume
redbarcount=0
redvolume=0
else
greenbarcount=0
greenvolume=0
redbarcount=1
redvolume=volume
endif
//media volumi rossi e verdi per media mobile semplice
mmred=summation[period](redvolume)/summation[period](redbarcount)
mmgreen=summation[period](greenvolume)/summation[period](greenbarcount)
return volbear coloured (205,0,0) style (histogram), volbull coloured (0,190,0) style (histogram), mmred coloured (255,0,0) as “Bear average”,mmgreen as “Bull average”,BullAD as “AD volume Bull”, BearAD as “AD volume Bear”
Ciao, mi da il seguente errore: “la seguente variabile non è definita: sum”
ref=(close-low)/range
volbull=ref*volume
volbear=volume
ADvolbull = volbull
ADvolbear = volume – ADvolbull
BullAD = summation[ADvolbull*((Close-Low) – (High-Close)) / (High-Low)]
BearAD = summation[ADvolbear*((Close-Low) – (High-Close)) / (High-Low)]
if close>=open then
greenbarcount=1
greenvolume=volume
redbarcount=0
redvolume=0
else
greenbarcount=0
greenvolume=0
redbarcount=1
redvolume=volume
endif
//media volumi rossi e verdi per media mobile semplice
mmred=summation[period](redvolume)/summation[period](redbarcount)
mmgreen=summation[period](greenvolume)/summation[period](greenbarcount)
return volbear coloured (205,0,0) style (histogram), volbull coloured (0,190,0) style (histogram), mmred coloured (255,0,0) as “Bear average”,mmgreen as “Bull average”
non riconosce su riga 6 e 7 summation. Ho aggiunto anche su ultima riga ,BullAD as “AD volume Bull”, BearAD as “AD volume Bear”
Ha ragione in computer, ho sbagliato io
BullAD = summation[period](ADvolbull*((Close-Low) – (High-Close)) / (High-Low))
BearAD = summation[period](ADvolbear*((Close-Low) – (High-Close)) / (High-Low))
Perfetto! Funziona. Grazie di tutto!
Bonjour,
J’essaye d’utiliser le script avec le graphique renko mais sa ne marche pas, quelqu’un pourrait m’aider.
Merci Hugo