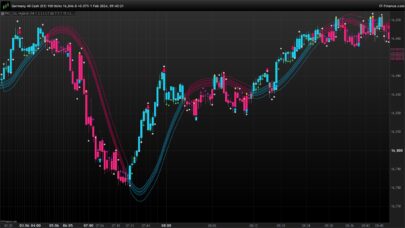
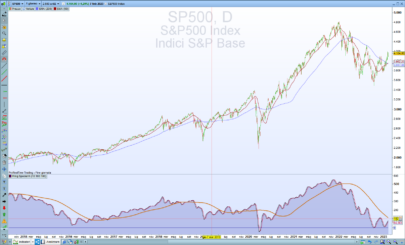
This indicator is based on a 2004 April issue of Technical Analysis of Stocks & Commodities article by David Sepiashvili.
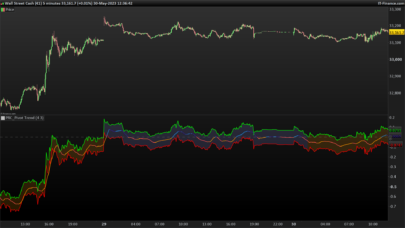
The indicator estimates trends in terms of noise is the trend-noise balance indicator (B-indicator). This indicator is calculated by dividing the absolute value of trend by noise added to absolute value of trend, and scaling the result appropriately.
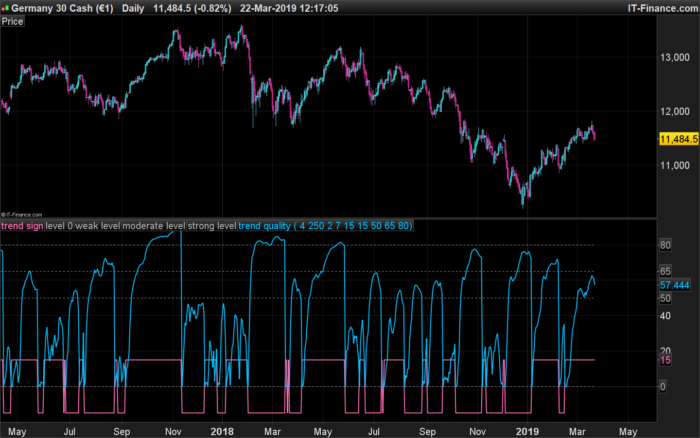
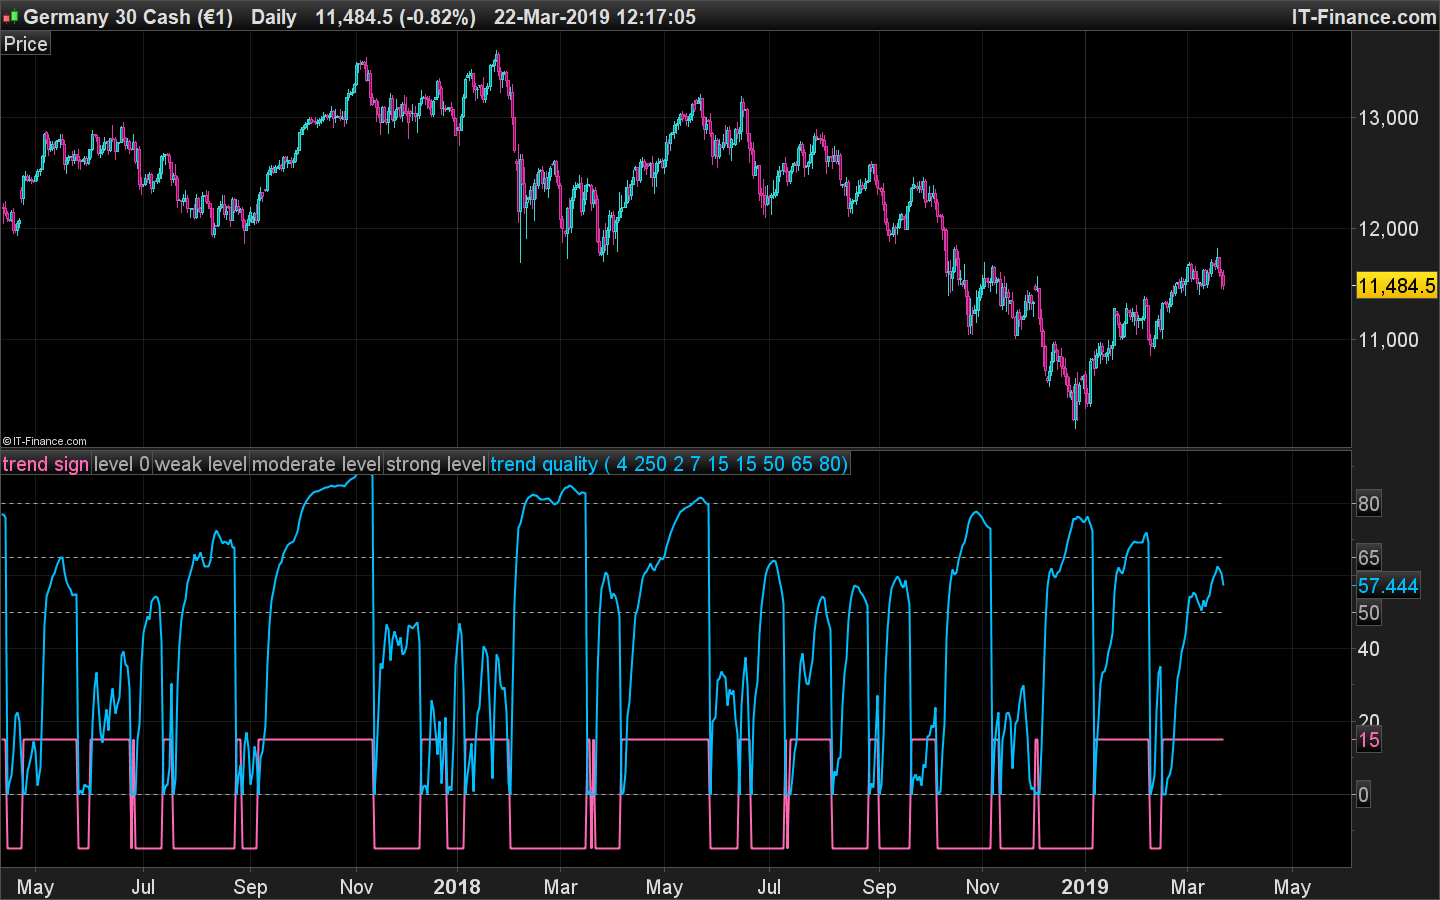
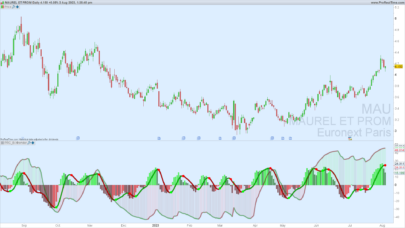
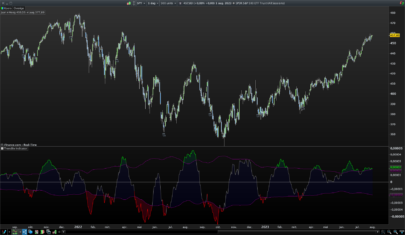
The B-indicator is a banded oscillator that fluctuates between zero and 100.
Another distinctive feature is that the B-indicator doesn’t show the direction of price movement, but only the existence of the trend and its strength. It requires additional tools for reversal
manifestations. The indicator’s interpretation is simple. The central line suggests that the trend
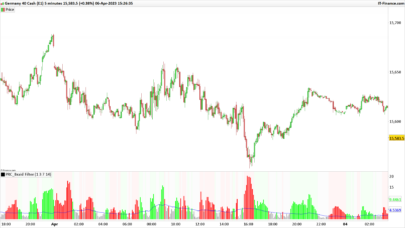
and noise are in equilibrium (trend is equal to noise). Readings in the 50–65 range indicate weak trending; those in the 65–80 range indicate moderate trending; and ranges above 80 indicate strong trending. The 65 level can be thought of as the demarcation line of trending and ranging
markets and can help determine which type of technical analysis indicator (lagging or leading) is
better suited to current market conditions.
|
1 2 3 4 5 6 7 8 9 10 11 12 13 14 15 16 17 18 19 20 21 22 23 24 25 26 27 28 29 30 31 32 33 34 35 36 37 38 39 40 41 42 43 44 45 46 47 48 49 50 51 52 53 54 55 56 57 58 59 60 61 62 63 |
//PRC_B-Trend quality | indicator //22.03.2019 //Nicolas @ www.prorealcode.com //Sharing ProRealTime knowledge //converted from MT4 version from mladen // --- settings TrendPeriod = 4 NoisePeriod = 250 CorrectionFactor = 2 FastLength = 7 SlowLength = 15 SignalMultiplier = 15 LevelWeakStart = 50 LevelModerateStart = 65 LevelStrongStart = 80 // --- end of settings Price = customclose once alpha1 = 2.0 / (1.0+FastLength) once alpha2 = 2.0 / (1.0+SlowLength) once emaf=price once emas=price if barindex>NoisePeriod then emaf = emaf[1]+alpha1*(price-emaf[1]) emas = emas[1]+alpha2*(price-emas[1]) imacd = emaf-emas if imacd>0 then sign = 1 endif if imacd<0 then sign = -1 endif if (SignalMultiplier>0) then trendQSign = sign*SignalMultiplier endif change = price-price[1] if sign<>sign[1] then cpc = 0 trend = 0 else cpc = sign*change+cpc[1] trend = cpc*(1.0/TrendPeriod)+trend[1]*(1.0-(1.0/TrendPeriod)) endif dt = (cpc-trend)*(cpc-trend) avgDt = 0 for k=0 to NoisePeriod-1 do avgDt = avgDt+dt[k] next avgDt = avgDt/NoisePeriod noise = CorrectionFactor*Sqrt(avgDt) temp = 1 if((Abs(trend)+noise)<>0) then temp = Abs(trend)+noise endif trendQ = 100.0*Abs(trend)/temp endif RETURN trendQSign coloured(255,105,180) style(line,2) as "trend sign", 0 coloured(168,168,168) style(dottedline) as "level 0", LevelWeakStart coloured(168,168,168) style(dottedline) as "weak level", LevelModerateStart coloured(168,168,168) style(dottedline) as "moderate level", LevelStrongStart coloured(168,168,168) style(dottedline) as "strong level", trendq coloured(0,191,255) style(line,2) as "trend quality" |
Share this
No information on this site is investment advice or a solicitation to buy or sell any financial instrument. Past performance is not indicative of future results. Trading may expose you to risk of loss greater than your deposits and is only suitable for experienced investors who have sufficient financial means to bear such risk.
ProRealTime ITF files and other attachments :
Find other exclusive trading pro-tools on ![]()
PRC is also on YouTube, subscribe to our channel for exclusive content and tutorials


Ottimo lavoro. come sempre!
Nello studio di Sepiashvili viene descritto anche un altro indicatore, il Q-indicator, che è calcolato dividendo il trend dal rumore dei prezzi. Sarebbe interessante averli tutti e due per valutarli su un grafico e confrontarne le performances. Io non sono capace di fare un simile lavoro di codifica e quindi rivolgo la richiesta ai molti ottimi programmatori che seguono questo sito, grazie!