%B Bollinger

%B Bollinger

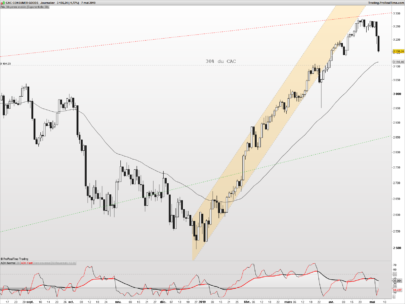
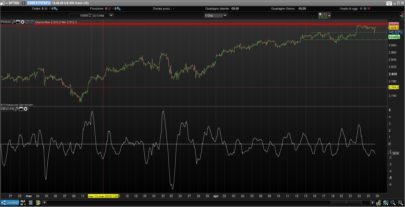
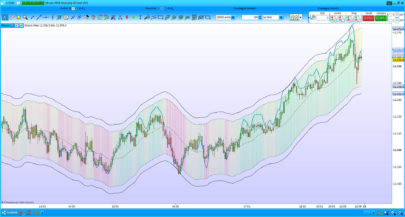
Bollinger oscillator

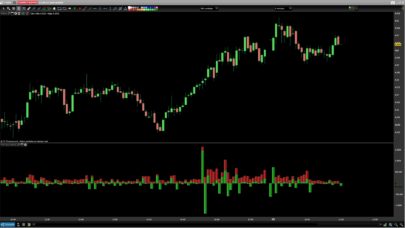
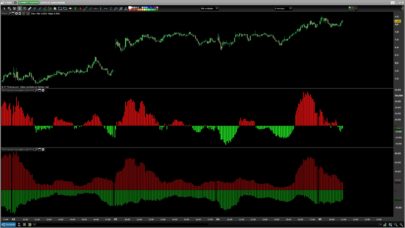
This is an extension of Bollinger bands. It shows the relative position of the closing price of the candle relative to the bands.

Zero value equals to a close on the lower bound. 50 value equals to a close on the Bollinger moving average. Finally, 100 value equals to a close on the upper bound.

This is an oscillator that provides overbought / oversold signals over 100 and under 0 levels. Divergences with price levels may be profited upon.

Share this

Risk disclosure:

No information on this site is investment advice or a solicitation to buy or sell any financial instrument. Past performance is not indicative of future results. Trading may expose you to risk of loss greater than your deposits and is only suitable for experienced investors who have sufficient financial means to bear such risk.

ProRealTime ITF files and other attachments : How to import ITF files into ProRealTime platform?

PRC is also on YouTube, subscribe to our channel for exclusive content and tutorials

  1. Dymjohn • 10/12/2015 #

    Hi 
    I don’t understand the maths of the width calculation in the above does it represent 2 above the average and 2 below the average. I was trying to amend the code for a 2.3 std but don’t come up with the same answer as provided by %b in standard indicators. Can anyone help please?
    For information I attach my attempt
    // Bollinger Band Oscillator
    delta = close-bollingerdown
    width = 4.6*std
    BBO = delta*100/width
    RETURN BBO AS \"bb Oscillator 2.3
     

  2. PEDRAM.JOKAR • 10/12/2015 #

    i also have same question. pls advise on how can have Bollinger B%(50,3)?

  3. Laurent • 10/12/2015 #

    Hi Nicolas
    There’s a problem to download file (400 Bad Request)
    Thanks for the indicator and have a nice day

    • Nicolas • 10/12/2015 #

      Hi, I fixed this issue. You can now download the file without any error.

  4. Laurent • 10/12/2015 #

    Thanks a lot

  5. oraclus • 10/12/2015 #

    Bonjour le %bollinger est protégé sur Prorealtime. Le code ci-dessus est paramétré par défaut à 20 périodes. Je souhaiterais le paramétré en 200 périodes. quel paramètre faudrait il mettre pour avoir le même que prorealtime en 200 périodes. Merci

    • Nicolas • 10/12/2015 #

      Le code dans ce post répond à cette demande d’adaptation de la période du %Bollinger: https://www.prorealcode.com/topic/bollinger-b/#post-41519

avatar
Register or

Likes

avatar avatar avatar avatar
Related users ' posts
cdc.andersson Hello, when trying to include this wonderful Dynamic RSI on my trading system i get the erro...
Rafyone Bonjour Nicolas et bonne année lol J'ai une erreur qui apparait concernant drawbarchart une...
Nicolas Je pense que tu n'utilises pas le bon éditeur de code, cette instruction est compatible uniq...
Kris75 Hi, This is great !! anyone ever developped a strategy about it ???
swapping hello Kris75, not that I know but it is possible to make a scenario ;)
digitation Hi swapping, Thanks for sharing this useful tool. I was wondering how difficult it would be...
Real Pro Great work gabri. I have this coded on Amibroker and I have done lots of backtesting but ne...
gabri Hi Real Pro, this indicator assists novices of the Wyckoff system. Wyckoff himself thought t...
tatie hi Gabri, I just came across the wyckoff method and was looking for the weiss wave indica...
Vonasi There is another version of this indicator that can plot the same lines but onto an indicato...
Martin35 Hello Vonasi, do you think it is possible with PRT to code with the same principle as on thi...
Vonasi A modified version of this indicator can be found here: https://www.prorealcode.com/topi...
abhay I am getting a shading between the lines, how can I avoid that. I just want to see lines as ...
Vonasi Delete the 'Color Zone' in the indicator settings window.
dau710 Are the Bulls Blue & the Bears Red?
dau710 Many thanks :)
Nicolas
6 years ago
Hans63 Thank you swapping
FREDNC @Nicolas merci pour se remarquable indicateur, reste à voir comment on va pourvoir l'intégre...
Diamant Bonjour à vous tous, D'après vous, quelle serais la bonne période pour du trading 15 minute...
arnaudat Merci nicolas, j'ai déjà pris cette version et en plus je suis sur les futures. Par contre d...
ullle73 hi nicolas, when im making a strategy out of this i get the error "PRC_VWAP z-score" called ...
Nicolas Please open a new topic in the ProOrder forum section and post the code there in order to ch...
hartgeld Hallo Atxeel, sehr interessanter Code, habe das installiert und funktioniert. Danke! Kannst ...
atxeel Hallo hartgeld, die Ziele sind schlicht, bspw. die Range beträgt 10 Punkte, dann ist das Zie...
AlexWoe89 Hi, thanks for the code. Do you have an idea, if you can also draw pre-market data on char...
Thomas Hello swapping. Very good idea. Can I use and modify the code? I would like to add a few mor...
Razz Hello swapping the indicator is very good! Can you tell me how I can add 2 lines in the dist...
swapping Hello wanjpt, I do not see how to do it because the calculation is for 12 candles of 5mn onl...
wanjpt Thanks swapping.
Thomas @wanjpt https://www.prorealcode.com/prorealtime-indicators/opening-range-eur-with-close-and...
Brisvegas Thats Awesome thank you
Vinks_o_7 Thanks Vonasi !
Tarkus1954 Hi. When I add this indicator it loads it in a separate window. How do I get the indicator...
Nicolas By adding it on the price chart. Use the wrench on the left upper side of the price chart.
ervelasco Thank you for your posting! I was missing the indicator when trying to select Keltner bands ...
swapping fib1236 = (hiday-lowday)*1.236+lowday DrawSegment(startbar,fib1236,barindex,fib1236) colou...
swapping Oups ! Nicolas il y a un problème avec l'insertion de code en utilisant le bouton [Add PRT ...
swapping fib1236 = (hiday-lowday)*1.236+lowday DrawSegment(startbar,fib1236,barindex,fib1236) colour...

Top