Description of this indicator from its author:
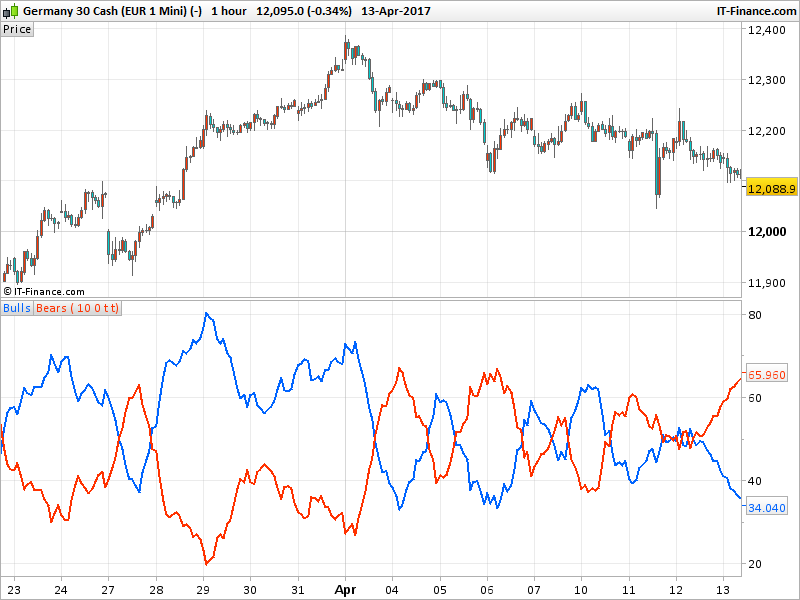
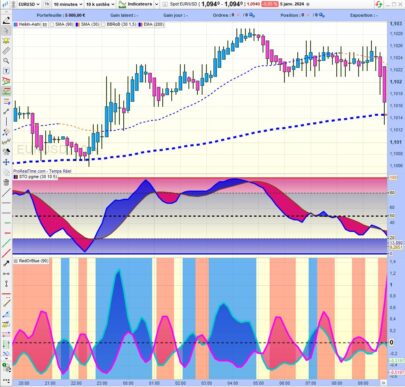
Average Sentiment Oscillator
Momentum oscillator of averaged bull/bear percentages.
We suggest using it as a relatively accurate way to gauge the sentiment of a given period of candles, as a trend filter or for entry/exit signals.
It’s a combination of two algorithms, both essentially the same but applied in a different way. The first one analyzes the bullish/bearishness of each bar using OHLC prices then averages all percentages in the period group of bars (eg. 10) to give the final % value. The second one treats the period group of bars as one bar and then determines the sentiment percentage with the OHLC points of the group. The first one is noisy but more accurate in respect to intra-bar sentiment, whereas the second gives a smoother result and adds more weight to the range of price movement. They can be used separately as Mode 1 and Mode 2 in the indicator settings, or combined as Mode 0.
Original indicator idea from Benjamin Joshua Nash, converted from MT4 version by a request in the english forum.
|
1 2 3 4 5 6 7 8 9 10 11 12 13 14 15 16 17 18 19 20 21 22 23 24 25 26 27 28 29 30 31 32 33 34 35 36 37 38 39 40 41 42 43 44 45 46 47 48 49 50 51 52 |
//PRC_AverageSentimentOscillator | indicator //16.04.2017 //Nicolas @ www.prorealcode.com //Sharing ProRealTime knowledge //https://www.prorealcode.com/topic/average-sentiment-oscillator/ //---Settings //AsoPeriod=10 //Mode=0 //ShowBulls=1 //(boolean) //ShowBears=1 //(boolean) //---end of settings intrahigh=High intralow =Low intraopen=Open intrarange = intrahigh-intralow grouplow = Lowest[AsoPeriod](low) grouphigh = Highest[AsoPeriod](high) groupopen = Open[AsoPeriod-1] grouprange = grouphigh-grouplow if (intrarange=0) then intrarange=1 endif if (grouprange=0) then grouprange=1 endif intrabarbulls = ((((close-intralow)+(intrahigh-intraopen))/2)*100)/intrarange groupbulls = ((((close-grouplow)+(grouphigh-groupopen))/2)*100)/grouprange intrabarbears = ((((intrahigh-close)+(intraopen-intralow))/2)*100)/intrarange groupbears = ((((grouphigh-close)+(groupopen-grouplow))/2)*100)/grouprange if (Mode=0) then TempBufferBulls=(intrabarbulls+groupbulls)/2 TempBufferBears=(intrabarbears+groupbears)/2 elsif (Mode=1) then TempBufferBulls=intrabarbulls TempBufferBears=intrabarbears elsif (Mode=2) then TempBufferBulls=groupbulls TempBufferBears=groupbears endif if ShowBulls then AsoBufferBulls=average[AsoPeriod](TempBufferBulls) endif if ShowBears then AsoBufferBears=average[AsoPeriod](TempBufferBears) endif RETURN AsoBufferBulls coloured(0,100,255) style(line,2) as "Bulls", AsoBufferBears coloured(255,50,0) style(line,2) as "Bears" |
Share this
No information on this site is investment advice or a solicitation to buy or sell any financial instrument. Past performance is not indicative of future results. Trading may expose you to risk of loss greater than your deposits and is only suitable for experienced investors who have sufficient financial means to bear such risk.
ProRealTime ITF files and other attachments :
Find other exclusive trading pro-tools on ![]()
PRC is also on YouTube, subscribe to our channel for exclusive content and tutorials


Salve, bellissimo indicatore, ma purtroppo non riesco a farlo funzionare
SALVE NICOLAS
MI SAPRESTI INDICARE UN INDICATORE PER INSERIRLO NELLA PIATTAFORMA PER FARE TRADING IN AUTOMATICO
GRAZIE
a me sembra simile al vortex o sbaglio??
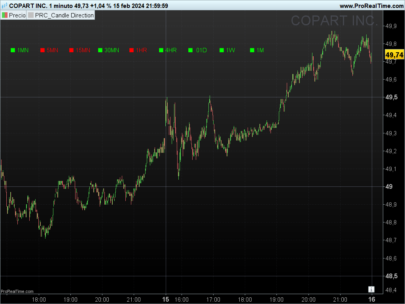
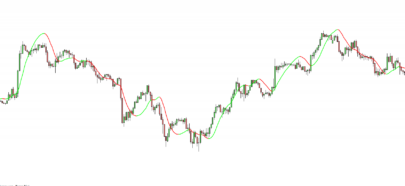
Quelqu’un a-t-il déjà remarqué, sur ce graphique, que les bougies montantes sont rouges et les descendantes sont vertes ? Y-a-t’il une raison bien connue ou est-ce simplement par vice ?
Bonjour,
Merci Mr Nicolas pour ce très bon indicateur. Une excellente stratégie qui est très robuste entre plusieurs contextes / périodes est d’utiliser la ligne “asobull” et de jouer le crossover d’un certain niveau pour LONG et le crossunder d’un certain niveau pour vendre, au lieu de la valeur 50. Et sinon quand quelqu’un poste un indicateur qui n’est pas présent initialement dans PRT ou un bout de code est-ce qu’on peut l’utiliser pour publier une stratégie ou utilisation? Bon début de semaine 🙂
Les codes postés sont libres et appartiennent à tous, faites en ce que vous voulez 🙂