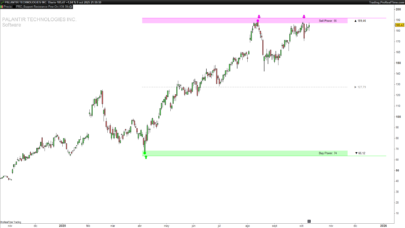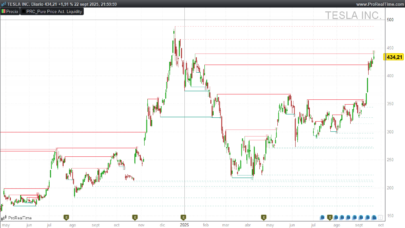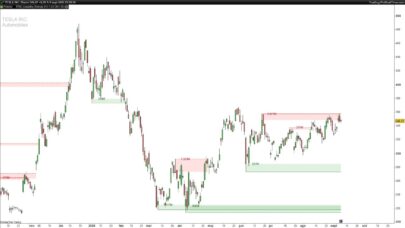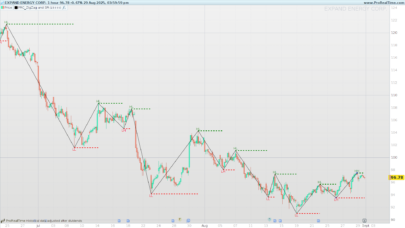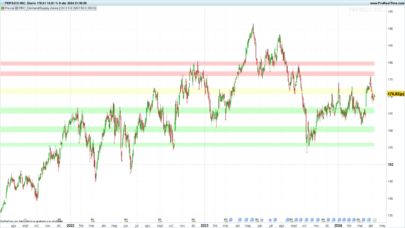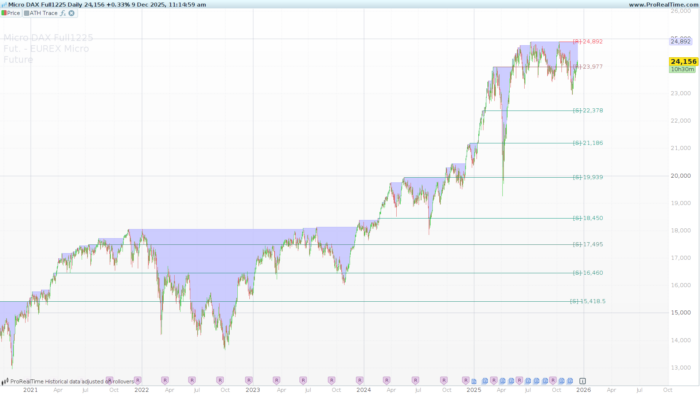
All-Time Highs (ATH) represent significant psychological barriers in financial markets. They act as “ceilings” where price discovery occurs, often triggering breakouts or strong rejections.
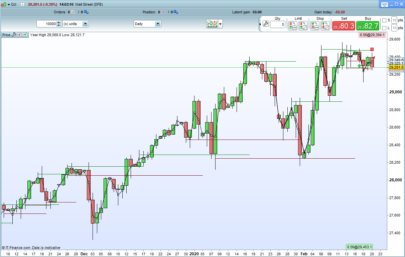
The ATH Levels indicator (by LuxAlgo) automates the detection of these historical peaks. Unlike a simple “Max Price” line, this tool identifies a sequence of significant historical highs and projects them forward, classifying them as dynamic Support or Resistance levels based on subsequent price action.
How it Works
This indicator scans the entire loaded history of an asset to identify every instance where a new All-Time High was established. However, simply plotting every single high would clutter the chart. To solve this, the indicator employs a smart filtering and classification system:
ATH Detection & Filtering:
The indicator tracks the global maximum price. It uses an ATR (Average True Range) filter to ensure that only distinct, significant levels are displayed. If a new ATH is too close to a previous one (based on the distMult setting), it is merged or ignored to keep the chart clean.
Dynamic Support/Resistance (S/R) Classification:
-
The indicator calculates how price interacts with each level after it was created.
-
Support (Bullish – Teal): If the price spends significant time above an old ATH level, that level is considered valid Support.
-
Resistance (Bearish – Red): If the price remains below an old ATH level, it acts as Resistance.
-
Visual Gradient: The lines change color dynamically. The solid lines are drawn from the historical point of the ATH extending to the right of the current price, making it easy to identify relevant levels for the current trading session.
Note: This indicator uses DEFPARAM DrawOnLastBarOnly = True. This means it is optimized for market analysis and chart reading, drawing the lines only on the most recent update to ensure fast performance.
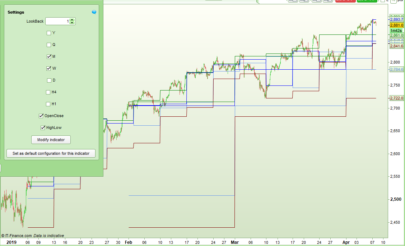
Settings & Configuration
You can customize the sensitivity and visual style of the indicator by modifying the variables at the beginning of the code:
-
showLast (Default: 50): Determines the maximum number of historical ATH lines to display on the chart. Reducing this number improves performance on charts with massive amounts of data.
-
duration (Default: 3): The minimum duration (in bars) required to confirm a new ATH level. Higher values filter out “noise” spikes.
-
distMult (Default: 3.0): This is the ATR Multiplier. It dictates the minimum vertical distance required between two ATH levels for them to be displayed separately.
-
Increase this value to see fewer, more significant levels.
-
Decrease this value to see more granular levels.
-
-
showClassification (Default: 1): Set to
1to display text labels ([S]for Support,[R]for Resistance) and the price level. Set to0to hide text. -
minSr (Default: 0): A filter for the strength of the Support/Resistance. Increasing this value will hide levels that are “neutral” (where price oscillates around the line without clear direction), showing only strong S/R levels.
The Code
|
1 2 3 4 5 6 7 8 9 10 11 12 13 14 15 16 17 18 19 20 21 22 23 24 25 26 27 28 29 30 31 32 33 34 35 36 37 38 39 40 41 42 43 44 45 46 47 48 49 50 51 52 53 54 55 56 57 58 59 60 61 62 63 64 65 66 67 68 69 70 71 72 73 74 75 76 77 78 79 80 81 82 83 84 85 86 87 88 89 90 91 92 93 94 95 96 97 98 99 100 101 102 103 104 105 106 107 108 109 110 111 112 113 114 115 116 117 118 119 120 121 122 123 124 125 126 127 128 129 130 131 132 133 134 135 136 137 138 139 140 141 142 143 144 145 146 147 148 149 150 151 152 153 154 155 156 157 158 159 160 161 162 163 164 165 166 167 168 169 170 171 172 173 174 175 176 177 178 |
// ----------------------------------------------- // PRC_All Time High (ATH) Levels [LuxAlgo] // version = 0 // 09.12.2025 // Iván González @ www.prorealcode.com // Sharing ProRealTime knowledge // ----------------------------------------------- defparam drawonlastbaronly=true // ----------------------------------------------- // --- Settings --- // ----------------------------------------------- showLast = 50 // Show Last ATH duration = 3 // ATH Minimum Duration distMult = 3.0 // Minimum Distance Between ATH (ATR Multiplier) showClassification = 1 // 1 = True, 0 = False (Show SR%) minSr = 0 // Minimum % for display // ----------------------------------------------- // --- Colors (RGB Configuration) --- // ----------------------------------------------- // Bullish (Support) - Teal bullR = 8 bullG = 153 bullB = 129 // Bearish (Resistance) - Red bearR = 242 bearG = 54 bearB = 69 // ----------------------------------------------- // --- Variables Initialization --- // ----------------------------------------------- ONCE maxPrice = 0 ONCE athCount = 0 ONCE x1 = 0 ONCE currentATR = 0 // Arrays to store ATH data ONCE $athsValue[0] = 0 // Stores the Price Level ONCE $athsBarIndex[0] = 0 // Stores the BarIndex of the ATH ONCE $priceDist[0] = 0 // Cumulative distance above level ONCE $totalPriceDist[0] = 0 // Cumulative absolute distance // ----------------------------------------------- // 1. Track All Time High // We check if the current High is higher than the previous global Max // ----------------------------------------------- IF BarIndex = 0 THEN maxPrice = High ELSE maxPrice = MAX(maxPrice, High) ENDIF // ATR Calculation for filtering currentATR = AverageTrueRange[200](Close) * distMult // Detect new ATH Candidate IF High > maxPrice[1] THEN x1 = BarIndex ENDIF // ----------------------------------------------- // 2. Confirm ATH Recency and Store It // ----------------------------------------------- IF BarIndex - x1 = duration THEN // Store data in arrays $athsValue[athCount] = maxPrice $athsBarIndex[athCount] = x1 // Initialize distance counters for this new level $priceDist[athCount] = 0 $totalPriceDist[athCount] = 0 athCount = athCount + 1 ENDIF // ----------------------------------------------- // 3. Update SR calculations for ALL stored ATHs // ----------------------------------------------- IF athCount > 0 THEN FOR i = 0 TO athCount - 1 DO currentLvl = $athsValue[i] // Calculate distances distPlus = MAX(Close - currentLvl, 0) absDist = ABS(Close - currentLvl) // Accumulate in arrays $priceDist[i] = $priceDist[i] + distPlus $totalPriceDist[i] = $totalPriceDist[i] + absDist NEXT ENDIF // ----------------------------------------------- // --- Drawing Logic (Last Bar Only) --- // ----------------------------------------------- IF IsLastBarUpdate THEN // 1. Draw the most recent ATH (Current Max) recentLvl = $athsValue[athCount - 1] recentIdx = $athsBarIndex[athCount - 1] DRAWSEGMENT(recentIdx, recentLvl, BarIndex + 10, recentLvl) COLOURED(bearR, bearG, bearB) IF showClassification THEN lev=round(recentLvl,2) DRAWTEXT("[R] #lev#", BarIndex + 25, recentLvl) COLOURED(bearR, bearG, bearB) ANCHOR(LEFT, INDEX, VALUE) ENDIF // 2. Draw Historical ATHs // We loop backwards to show the most recent ones first, respecting 'showLast' prevLvl = recentLvl countDisplayed = 0 // Loop from the second to last stored ATH down to the first one // Check if athCount is sufficient to avoid loop errors IF athCount > 1 THEN FOR i = athCount - 2 DOWNTO 0 DO // Limit the number of lines displayed IF countDisplayed < showLast THEN currentHistLvl = $athsValue[i] dist = prevLvl - currentHistLvl // Filter: Only show if distance from previous drawn level is > ATR * Multiplier IF dist >= currentATR THEN // Calculate SR Percentage pDist = $priceDist[i] tDist = $totalPriceDist[i] normDist = 0 IF tDist > 0 THEN normDist = (1 - (pDist / tDist)) * 100 ENDIF // Color Calculation (Gradient Simulation) // 0 = Full Green (Support), 100 = Full Red (Resistance) colorFactor = normDist / 100 finalR = ROUND(bullR + (bearR - bullR) * colorFactor) finalG = ROUND(bullG + (bearG - bullG) * colorFactor) finalB = ROUND(bullB + (bearB - bullB) * colorFactor) displayPct = ABS(normDist - 50) * 2 // Check Minimum % Filter IF displayPct >= minSr THEN // Draw Line thisX = $athsBarIndex[i] DRAWSEGMENT(thisX, currentHistLvl, BarIndex + 10, currentHistLvl) COLOURED(finalR, finalG, finalB) // Draw Label IF showClassification THEN // Determine Label (Support or Resistance) lev=round(currentHistLvl,2) IF normDist < 50 THEN DRAWTEXT("[S] #lev#", BarIndex + 25, currentHistLvl) COLOURED(finalR, finalG, finalB) ANCHOR(LEFT, INDEX, VALUE) ELSE DRAWTEXT("[R] #lev#", BarIndex + 25, currentHistLvl) COLOURED(finalR, finalG, finalB) ANCHOR(LEFT, INDEX, VALUE) ENDIF ENDIF // Update tracking variables prevLvl = currentHistLvl countDisplayed = countDisplayed + 1 ENDIF ENDIF ELSE BREAK // Stop loop if we reached showLast limit ENDIF NEXT ENDIF ENDIF // ----------------------------------------------- // --- Background Plots --- // ----------------------------------------------- COLORBETWEEN(Close, maxPrice, 200, 200, 255, 230) // Light Blue very transparent // ----------------------------------------------- RETURN maxPrice AS "ATH Trace" COLOURED(0,0,255,35) |
Share this
No information on this site is investment advice or a solicitation to buy or sell any financial instrument. Past performance is not indicative of future results. Trading may expose you to risk of loss greater than your deposits and is only suitable for experienced investors who have sufficient financial means to bear such risk.
ProRealTime ITF files and other attachments :
Find other exclusive trading pro-tools on ![]()
PRC is also on YouTube, subscribe to our channel for exclusive content and tutorials