This article provides a comprehensive guide to the AI Trend Navigator, an advanced technical indicator that leverages a K-Nearest Neighbors (KNN) machine learning logic to identify market trends and predict potential reversals directly within ProRealTime.
What is the AI Trend Navigator?
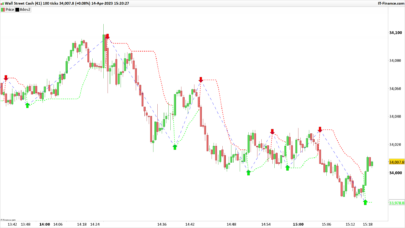
The AI Trend Navigator is designed to filter market noise by comparing current price action against a historical “window” of data. Unlike standard moving averages that simply lag behind the price, this tool uses a KNN Classifier to find the most similar historical data points (the “neighbors”) and uses their average to project a cleaner, more responsive trend line.
The indicator is highly versatile, allowing users to choose between various calculation methods such as VWAP, Exponential Moving Averages (EMA), and Hull Moving Averages (HMA) for both the data database and the current target.
How It Works: Technical Insights
The core of this indicator is a learning loop that performs the following steps:
-
Database Creation (
valueIn): The script calculates a series of historical values based on your chosen source (e.g., Mid-Price, VWAP, or SMA). -
Target Comparison (
targetIn): It identifies the current market state using a separate target calculation. -
Distance Calculation: For every bar in the historical window (default is 30 bars), the script calculates the absolute “distance” between the current target and past values.
-
KNN Averaging: It identifies the K (number of closest values) smallest distances and averages their corresponding prices to produce the Knn Classifier Line.
-
AI Prediction: It looks back at the 10 most recent patterns to see if similar price movements historically resulted in a bullish or bearish shift, which is then visualized via the background color.
Key Visual Elements
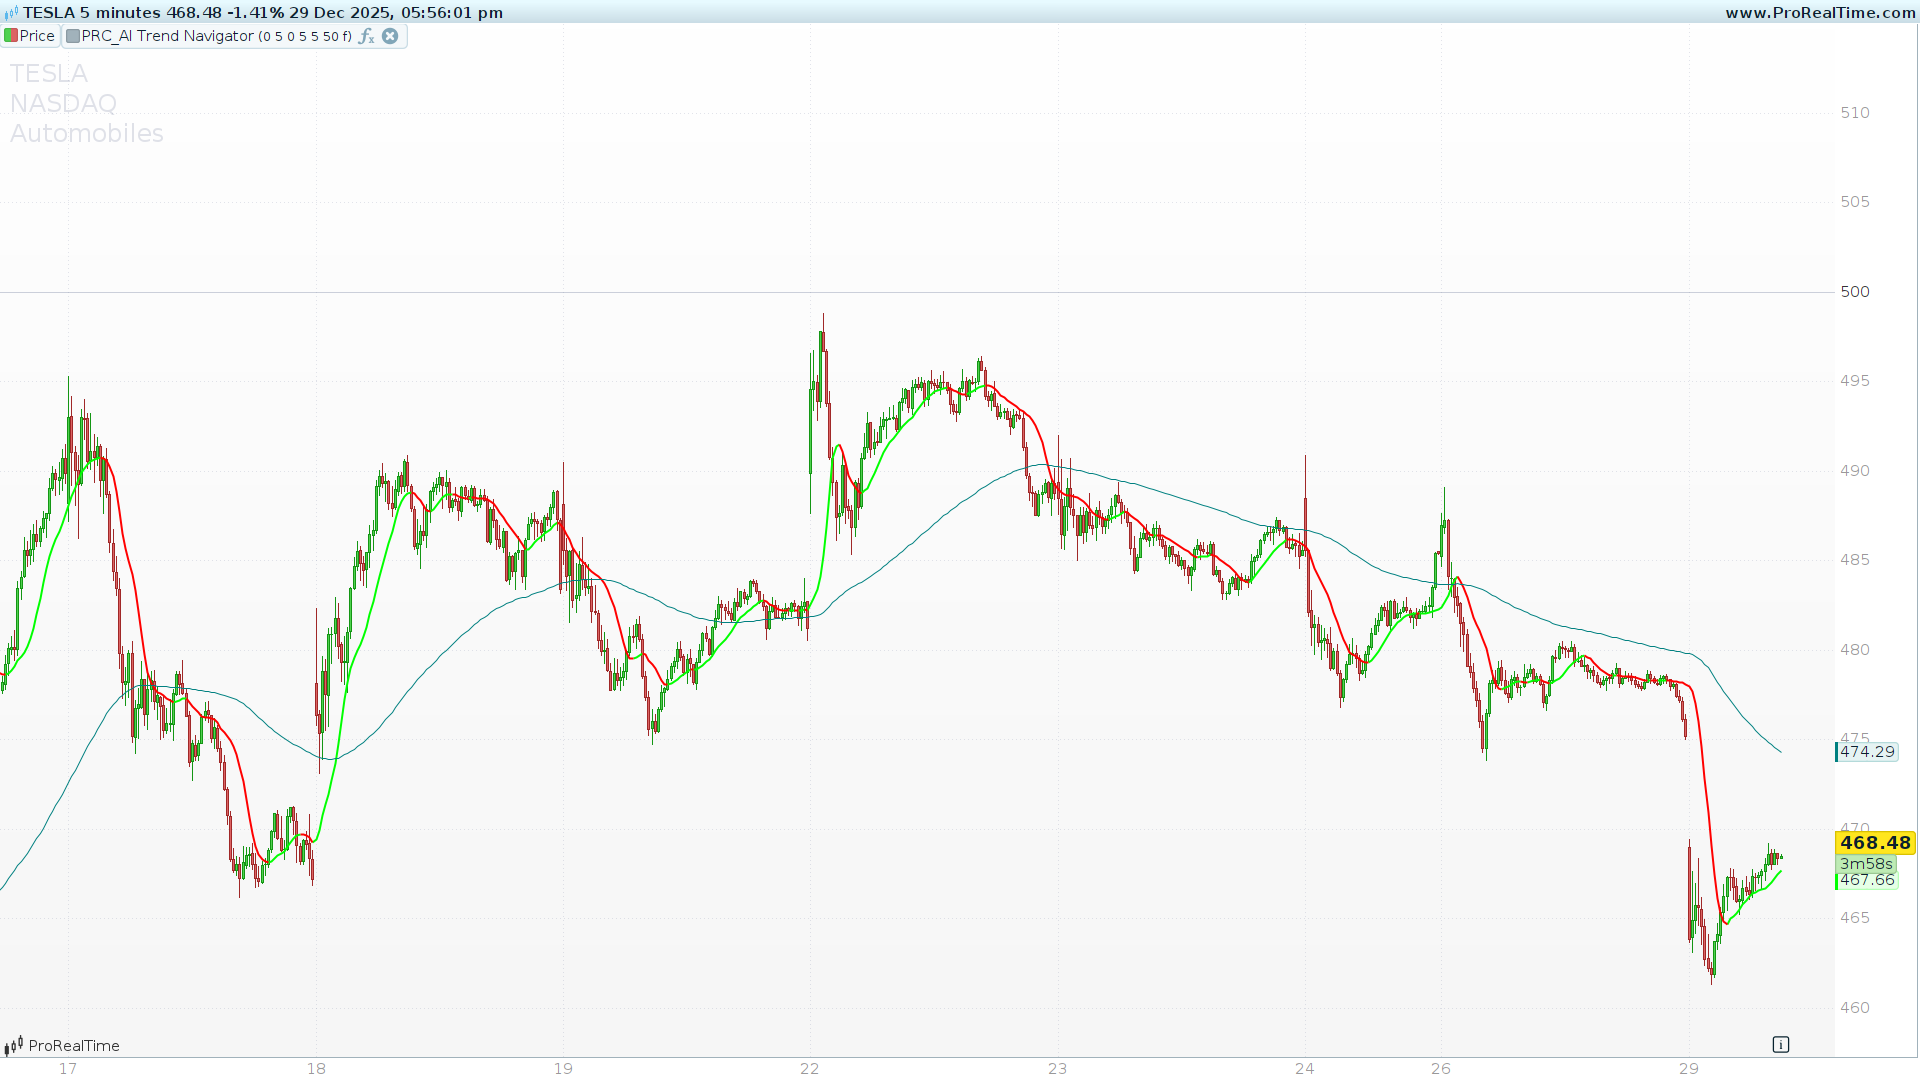
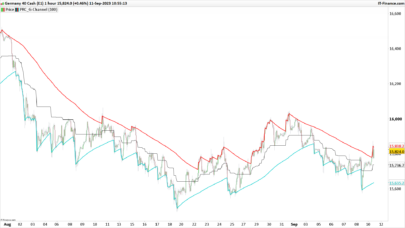
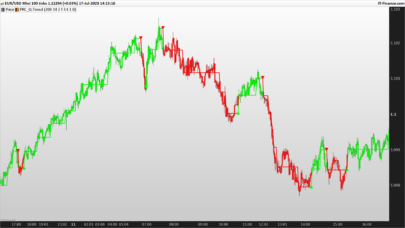
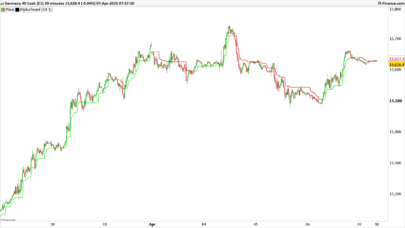
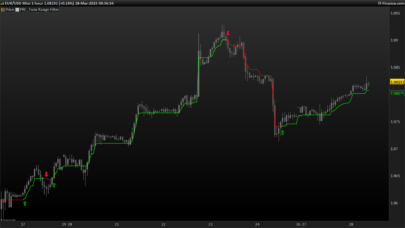
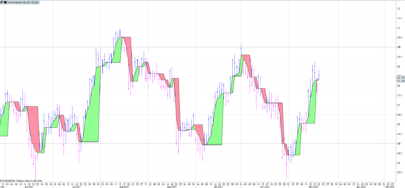
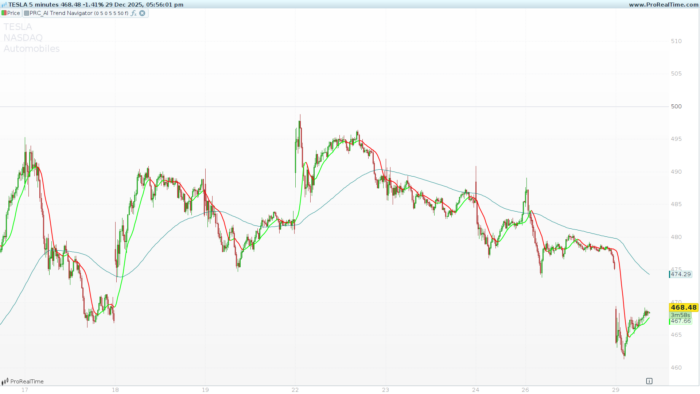
1. The Knn Classifier Line (Thick Line)
This is your primary trend signal. It is dynamically colored based on its slope:
-
Green: The KNN line is rising, indicating a bullish trend.
-
Red: The KNN line is falling, indicating a bearish trend.
-
Orange: The line is neutral or flat.
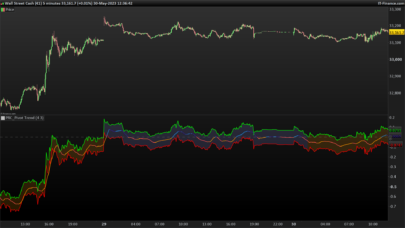
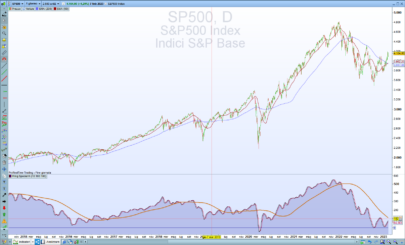
2. Average Knn Classifier Line (Thin Teal Line)
This line acts as a long-term baseline (smoothed by a Wilder Average). It helps traders distinguish between minor fluctuations and major trend shifts.
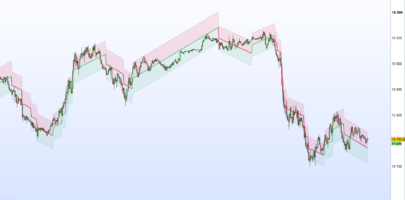
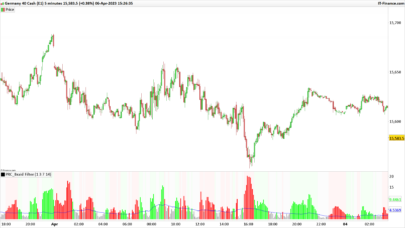
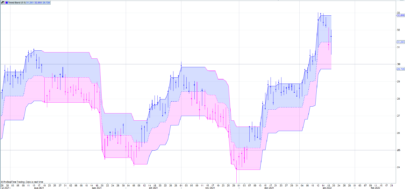
3. Predictive Background (Optional)
If enabled, the background provides a visual “forecast” from the AI logic:
-
Green Background: The AI logic predicts a higher probability of an upward move.
-
Red Background: The AI logic predicts a higher probability of a downward move.
Configuration & Settings
You can customize the indicator through the Variables menu in ProBuilder without touching the code.
| Input Variable | Default | Description |
priceValue |
0 |
Source for the “Database” (0=HL2, 1=VWAP, 2=SMA, 4=EMA, etc.) |
maLen |
5 |
The period used to calculate the database values. |
targetValue |
0 | The current target for comparison (0=Wilder, 1=VWAP, etc.). |
numberOfClosestValues |
3 | The “K” in KNN. Higher values result in more smoothing. |
smoothingPeriod |
50 |
Long-term smoothing for the baseline and AI logic. |
bgColour |
0 |
Toggle (0 or 1) to enable/disable the predictive background. |
ProBuilder Code
The following code should be pasted into the ProBuilder editor. Ensure you define the variables listed above in the “Variables” section of the indicator settings to enable full customization.
|
1 2 3 4 5 6 7 8 9 10 11 12 13 14 15 16 17 18 19 20 21 22 23 24 25 26 27 28 29 30 31 32 33 34 35 36 37 38 39 40 41 42 43 44 45 46 47 48 49 50 51 52 53 54 55 56 57 58 59 60 61 62 63 64 65 66 67 68 69 70 71 72 73 74 75 76 77 78 79 80 81 82 83 84 85 86 87 88 89 90 91 92 93 94 95 96 97 98 99 100 101 102 103 104 105 106 107 108 109 110 111 112 113 114 115 116 117 118 119 120 121 122 123 124 125 126 127 128 129 130 131 132 133 134 135 136 137 138 139 140 141 142 143 144 145 146 147 148 149 150 151 152 153 154 155 |
//---------------------------------------------- //PRC_AI Trend Navigator //version = 0 //24.04.24 //Iván González @ www.prorealcode.com //Sharing ProRealTime knowledge //---------------------------------------------- // --- Inputs --- //---------------------------------------------- priceValue=0 // 0=hl2, 1=VWAP, 2=sma, 3=wma, 4=ema, 5=hma maLen= 5 targetValue=0 //0=Price Action, 1=VWAP, 2=Volatility, 3=sma, 4=wma, 5=ema, 6=hma maLen1= 5 numberOfClosestValues= 3 smoothingPeriod= 50 bgColour=0// Boolean (0 or 1) once windowSize = max(numberOfClosestValues, 30) //---------------------------------------------- // --- PriceValue calculation (valueIn) //---------------------------------------------- if priceValue = 0 then valueIn = average[maLen]((high + low) / 2) elsif priceValue = 1 then valueIn = VolumeAdjustedAverage[maLen](close) elsif priceValue = 2 then valueIn = average[maLen](close) elsif priceValue = 3 then valueIn = weightedaverage[maLen](close) elsif priceValue = 4 then valueIn = exponentialaverage[maLen](close) elsif priceValue = 5 then valueIn = hullaverage[maLen](close) else valueIn = close endif //---------------------------------------------- // --- Target input calculation (targetIn) //---------------------------------------------- if targetValue = 0 then targetIn = WilderAverage[maLen1](close) elsif targetValue = 1 then targetIn = VolumeAdjustedAverage[maLen1](close) elsif targetValue = 2 then targetIn = AverageTrueRange[14](close) elsif targetValue = 3 then targetIn = average[maLen1](close) elsif targetValue = 4 then targetIn = weightedaverage[maLen1](close) elsif targetValue = 5 then targetIn = exponentialaverage[maLen1](close) elsif targetValue = 6 then targetIn = hullaverage[maLen1](close) else targetIn = close endif //---------------------------------------------- // --- KNN Classifier //---------------------------------------------- // Initialize arrays with a very high distance for k = 0 to numberOfClosestValues - 1 do $closestDistances[k] = 10000000000 $closestValues[k] = 0 next for i = 1 to windowSize do currentVal = valueIn[i] distance = abs(targetIn - currentVal) // Find the maximum distance currently in our "Top K" list maxDistValue = $closestDistances[0] maxDistIndex = 0 for j = 1 to numberOfClosestValues - 1 do if $closestDistances[j] > maxDistValue then maxDistValue = $closestDistances[j] maxDistIndex = j endif next // If the new distance is smaller than the largest in the list, replace it if distance < maxDistValue then $closestDistances[maxDistIndex] = distance $closestValues[maxDistIndex] = currentVal endif next // Manual sum of the closest values array knnSum = 0 for k = 0 to numberOfClosestValues - 1 do knnSum = knnSum + $closestValues[k] next knnMA = knnSum / numberOfClosestValues //---------------------------------------------- // --- KNN Prediction Logic //---------------------------------------------- priceMid = (knnMA + close) / 2 cRMA = WilderAverage[smoothingPeriod](knnMA[1]) oRMA = WilderAverage[smoothingPeriod](knnMA) posCount = 0 negCount = 0 minDist = 10000000000 for j = 1 to 10 do distPred = abs(priceMid[j] - priceMid) if distPred < minDist then minDist = distPred if cRMA[j] < oRMA[j] then posCount = posCount + 1 elsif cRMA[j] > oRMA[j] then negCount = negCount + 1 endif endif next if posCount > negCount then predictionRaw = 1 else predictionRaw = -1 endif knnPrediction = weightedaverage[3](predictionRaw) //---------------------------------------------- // --- Visualization and Lines //---------------------------------------------- knnLine = weightedaverage[5](knnMA) maKnnLine = WilderAverage[smoothingPeriod](knnMA) // Colors for the main line if knnLine > knnLine[1] then r = 0 g = 255 b = 0 elsif knnLine < knnLine[1] then r = 255 g = 0 b = 0 else r = 255 g = 165 b = 0 endif // Background Logic if bgColour = 1 then if knnPrediction < 0.5 then // Trend Down (Red) backgroundcolor(255, 82, 82, 35) elsif knnPrediction > -0.5 then // Trend Up (Green) backgroundcolor(0, 230, 118, 35) endif endif //---------------------------------------------- return knnLine as "Knn Classifier Line" coloured(r, g, b) style(line, 2), maKnnLine as "Average Knn Classifier Line" coloured(0, 128, 128) style(line, 1) |
Share this
No information on this site is investment advice or a solicitation to buy or sell any financial instrument. Past performance is not indicative of future results. Trading may expose you to risk of loss greater than your deposits and is only suitable for experienced investors who have sufficient financial means to bear such risk.
ProRealTime ITF files and other attachments :
Find other exclusive trading pro-tools on ![]()
PRC is also on YouTube, subscribe to our channel for exclusive content and tutorials