No Trend Strategy

No Trend Strategy

This strategy uses the “TrendNoTrend indicator” (see in the library).
Once the “No Trend” phase has been identified (beta = 0), swing trading will take place: BUY MIN and SELL MAX. To do this you can use, for example, a SmoothedStochastic.
A simple SuperTrend [3,10] follows the position.
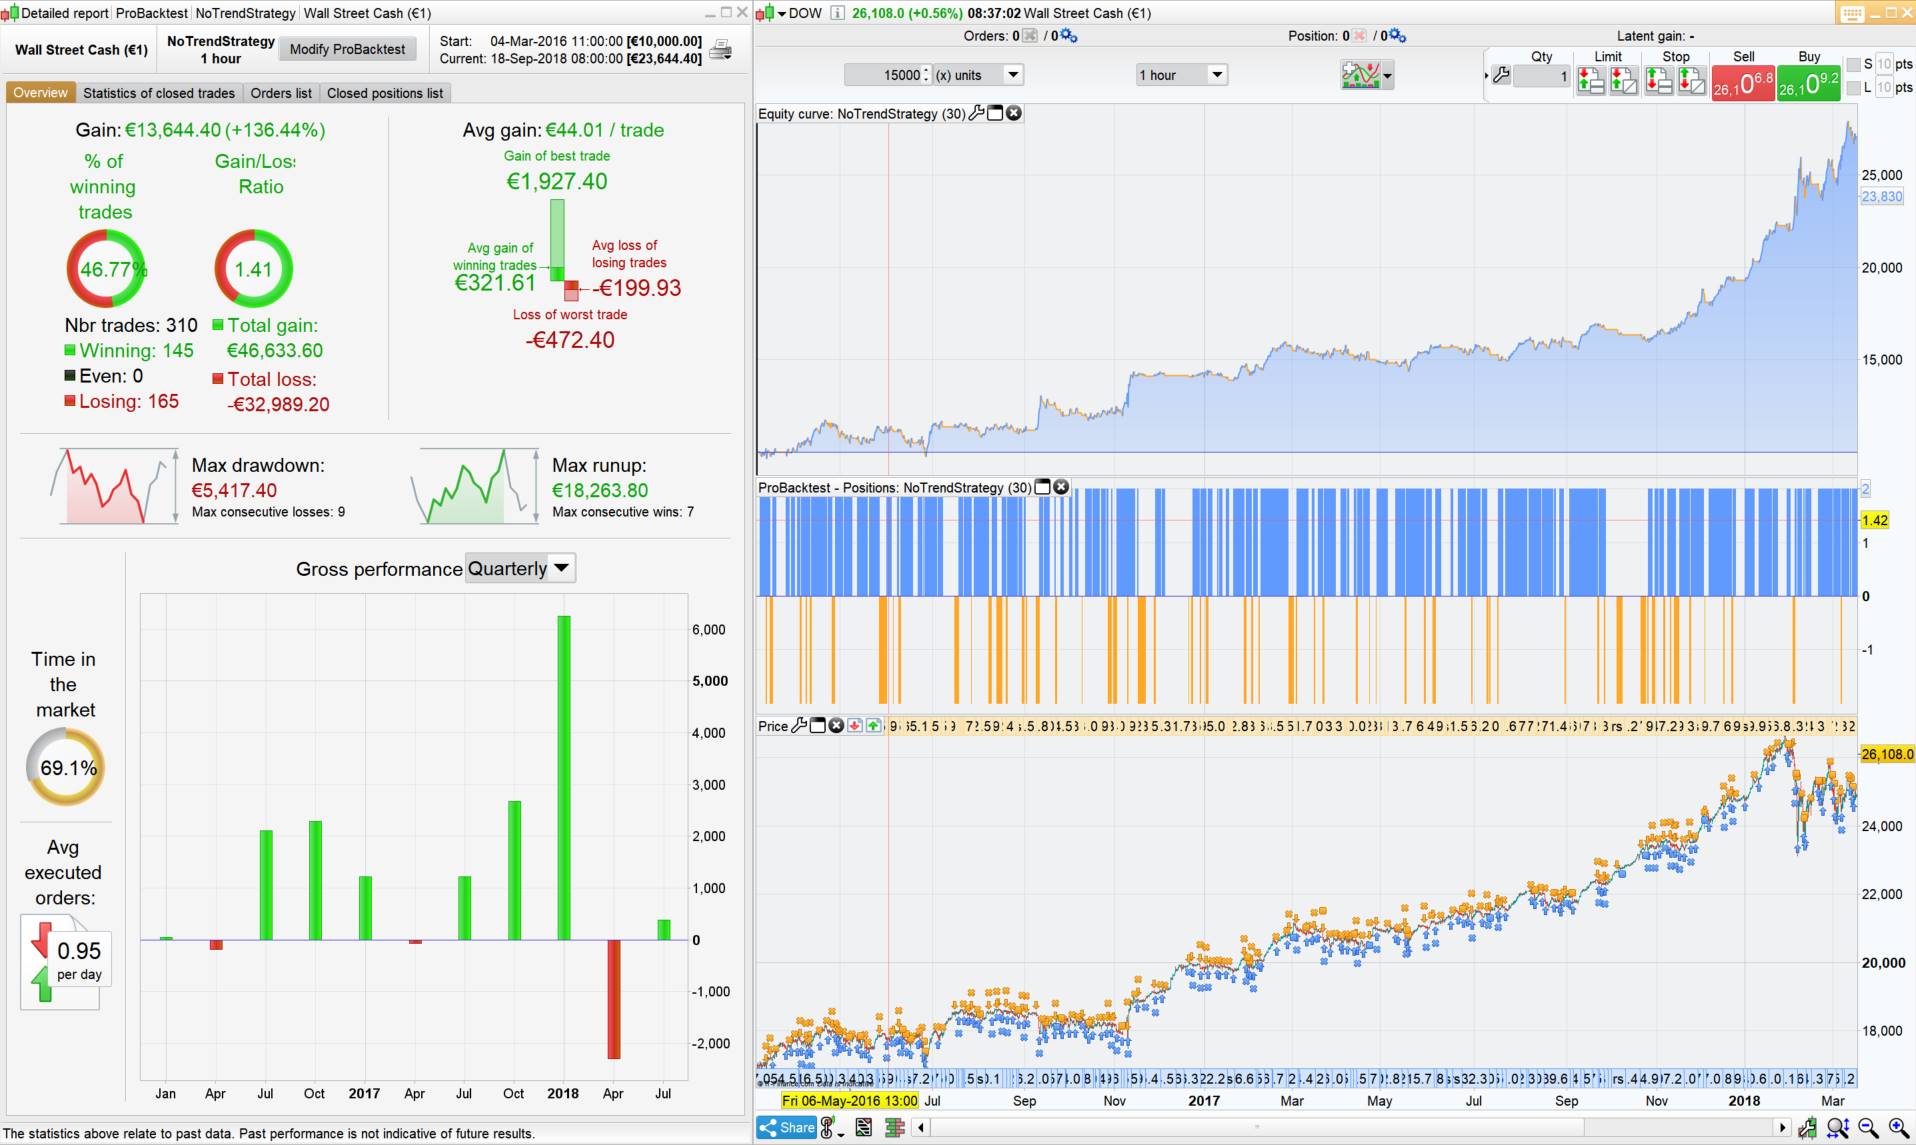
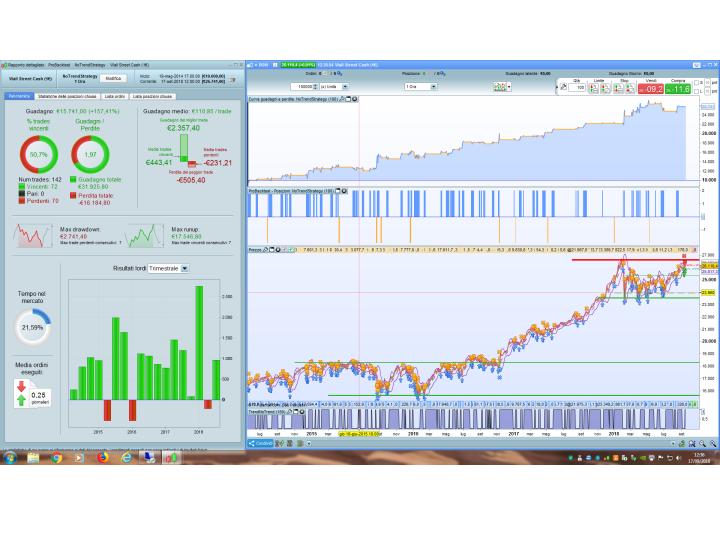
It seems to have positive results on different indices and different time frames, after optimization of the observation period.


Share this

Risk disclosure:

No information on this site is investment advice or a solicitation to buy or sell any financial instrument. Past performance is not indicative of future results. Trading may expose you to risk of loss greater than your deposits and is only suitable for experienced investors who have sufficient financial means to bear such risk.

ProRealTime ITF files and other attachments : How to import ITF files into ProRealTime platform?

PRC is also on YouTube, subscribe to our channel for exclusive content and tutorials

  1. Nicolas • 09/18/2018 #

    Thank you for sharing this strategy. Although I think the optimization should be done with Walk Forward to test its robustness, I salute the work and the idea. This strategy deserves to attract more attention than in a topic “lost” in the forum, it has its place in the library 🙂
    PS: I changed your illustration picture with another one (it was too small 🙂 )

  2. Teddy Coronak • 09/18/2018 #

    Merci pour cette stratégie. comment remplacez les variables par les valeurs fixes ?
    à quel endroit dois je remplacer ? c’est le pro order qui me le demande.

    • FULVIO09 • 09/18/2018 #

      At line 15 establish the value of “period”. For example: AA = 180

  3. FULVIO09 • 09/18/2018 #

    Sorry for lines 39 and 62 we need to set the ABS value:
    39 ST = ABS ((LOWEST [10] (LOW)) – OPENBUY) / PXT
    62 ST = ABS (OPENSELL- (HIGHEST [10] (HIGH))) / PXT

  4. Teddy Coronak • 09/18/2018 #

    Bonjour merci BEAUCOUP !!!
    cela fonctionne!!!

  5. Dymjohn • 09/18/2018 #

    Good piece of work. I’ve tried trading in live but always falls over suggesting I haven’t loaded enough bars. I changed code to set DEFPARAM to 2000 and still suggests not enough bars on the 10 minute time frame. Any ideas as to what might be wrong? The period of linear regression is set to 240.

    • FULVIO09 • 09/18/2018 #

      I ran the strategy on differents instruments and timeframes and I never encountered problems. Sorry but I have no idea how to solve your problem.

  6. POLLO • 09/18/2018 #

    ciao Fulvio continua a dirmi di sostituire le variabili. Come posso risolvere?
    scusa ma sono ignorante in materia

    • FULVIO09 • 09/18/2018 #

      Con il file notrendstrategy.itf che hai scaricato puoi eseguire un probacktest sullo strumento finanziario e timeframe che preferisci e trovare il valore della variabile “period” che ti dà la migliore performance.
      Se vuoi avviare l’autotrading proorder sullo strumento e time frame prescelto devi fissare alla linea 15 il valore di period (ad es. AA = 180) e cliccare sull’icona a forma di chiave inglese in alto a destra “ottimizzazione variabili” cancellare le variabili da ottimizzare (clicca sulla x rossa).

  7. kuroobi • 09/18/2018 #

    FULVIO09 • 25 days ago #

    At line 15 establish the value of “period”. For example: AA = 180

    avatar
    FULVIO09 • 25 days ago #

    Sorry for lines 39 and 62 we need to set the ABS value:
    39 ST = ABS ((LOWEST [10] (LOW)) – OPENBUY) / PXT
    62 ST = ABS (OPENSELL- (HIGHEST [10] (HIGH))) / PXT

    Même après cette manipulation , ça ne fonctionne pas pour moi .
    Pouvez vous expliquer en détail ?

    • FULVIO09 • 09/18/2018 #

      Avec le file notrendstrategy.itf, vous pouvez exécuter un probacktest sur l’instrument financier et la période que vous préférez et trouver la valeur de la variable “period” qui vous offre les meilleures performances.
      Si vous souhaitez démarrer le processus de négociation automatique sur l’instrument et la période choisie, vous devez fixer la valeur de period à la ligne 15 (par exemple AA = 180) et cliquer sur l’icône en forme de clé en haut à droite “optimisation variables” effacer la variable “period” à optimiser (cliquez sur la x rouge).

    • Johann • 09/18/2018 #

      Hi @FULVI09,
      I understand the instructions however I’m not too sure how to determine the “period” that generate the best performance, you mentioned 180 in the previous post, could you kindly explain where you got it from and what method you use to determine the “period” that generate the best performance.
      Thanks for your contribution and looking forward to read your response.
      Regards,
      Johann.

  8. kuroobi • 09/18/2018 #

    Parfait , merci beaucoup .

  9. Juan Salas • 09/18/2018 #

    Hi FULVIO09,

    Nice piece of work. It seems to work very well. Does only work for INDEXES?? Have you tried it on commodities or FOREX???
    Many thanks,

  10. Player8520 • 09/18/2018 #

    Hello,

    It doesn’t work with me either.
    However, I changed AA to 180 on line 15, added the abs functions to the 2 lines indicated 39 and 62, preloaded 2000 bars and deleted the variable to be optimized.

    Has anyone found the fault since?

    Thank you.

avatar
Register or

Likes

avatar avatar avatar avatar avatar avatar avatar avatar avatar avatar avatar avatar avatar avatar avatar avatar

+10 more likes

Related users ' posts
Iván
2 weeks ago
Gaspare Grazie Ivan una domanda: quale TF ci puoi suggerire per operare sugli indici americani CFD?
Iván I personally like it in daily timeframe
Iván
1 month ago
Madrosat Hello Ivan You have interesting topics on indicators , smart supertrend, optimised trend t...
Iván Hi! thanks. All of these codes are translations requested in the forum. I've on mind to back...
WE ARE SOCIETY Bonjour, je ne pratique pas le DJ et donc il me faudrait bcp trop de temps pour faire un alg...
KumoNoJuzza Bonjour. Je le teste depuis lundi. Je suis à 37 points de gain sur la semaine soit 37 € à 1€...
WE ARE SOCIETY Bonjour KumoNoJuzza, en réalité ça dépend aussi de la volatilité, chaque période est différe...
finplus Bonjour, une petite demande concernant cet indicateur : comment faire pour que lorsque la bo...
LucasBest Bonjour, la coloration des bandes se fait ligne 111 et 112 à l'aide des instructions colorbe...
Nicolas Simple strategy with this indicator is available here: https://www.prorealcode.com/topic/ut-...
FXtonio Nicolas.... MERCI 1 millions de fois, cet indicateur gagne dans 75% des cas en scalping m1 ...
davy42 bonjour, à quel moment apparait le fleche, à l'ouverture ou la fermeture de la bougie? merci
JS
9 months ago
YvesRobert Bonjour Nicolas, concernant cet indicateur j'ai voulu l'utiliser mais il commence à tracer l...
Nicolas Je ne rencontre pas ce problème avec le NASDAQ par exemple, ce serait plus simple d'ouvrir u...
YvesRobert Bonjour Nicolas, en effet ca marche, je me suis trompé, j'ai bien tout le tracé. C'est parce...
Jiacky
2 years ago
Range Factor
Range Factor
0
Indicators
AndPar Buongiorno Nicolas, vorrei provare questo indicatore, ma quando lo inserisco in PRT mi vengo...
Nicolas Basta aggiungerlo al prezzo https://www.prorealcode.com/blog/video-tutorials/how-to-add-an-i...
Aragorna hello Nicolas, this indicator works with the last Beta version of PRT? Ive seen tha many in...
Sever
2 years ago
Stenozar Hi Sever, how can I visualize the coloured areas?
Sever Hi Stenozar, You need to add the color zones yourself , just go to Add Color Zone To set ...
Boris Hi IVMcm, thanks for your amazing work. I have tested all of your indicators and use some of...
IV Mcm With pleasure and thanks!
ashiash how to use this indicator can i use tradingview platform
AntoGH Bonjour peut-on backtester cela ? Et si vous l'avez fait pourriez vous nous donner le code.....
Nicolas désolé c'est un oubli de ma part, tu peux supprimer cette ligne, elle n'est plus utile dans ...
DELBERT Bonjour , Nicolas , merci pour ta réponse , je suis en effet avec PRT 10.3 , et j'ai bidouil...
RakeshPoluri I have a question about the bands on the candles. Is it bollinger bands or something else?
Nicolas I think that's 2 Bollinger Bands
Seabiscuit Hi! I like this indicator a lot, been using it on a 30 min timeframe and usually confirms my...
Ramahu Bonjour et merci pour cet indicateur ! je l'observe sur les actions du Nasdaq et la plupart ...
IV Mcm Line 68 and 70, you must delete the instruction at the end of the line "" Bordercolor(0,0,0,...
BoutDePain This instruction is for the V11 maybe that you are using V10.3 then you can safely remove it.
Protagonist Bonjour, Je vois l'instruction inRange mais je ne trouve pas sa signification. Pouvez-vous...
Nicolas
3 years ago
Nicolas La définition des couleurs se situent entre les lignes 94 et 118. Selon le type de bougie (h...
Manu35250 Bonjour Nicolas, Est il possible de convertir cet indicateur en screener ? J'essaie depui...
Nicolas Bien sûr, merci de formuler la demande dans le forum approprié en respectant les règles de p...
PHAN100 bonjour, bravo à l'auteur pour cet indicateur visuel sur le graphique, il nous reste à va...

Top