



 ProRealCode - Trading & Coding with ProRealTime™



Coloured Price Bands
January 27, 2022, 9:25 AM
Indicators
0 Comments
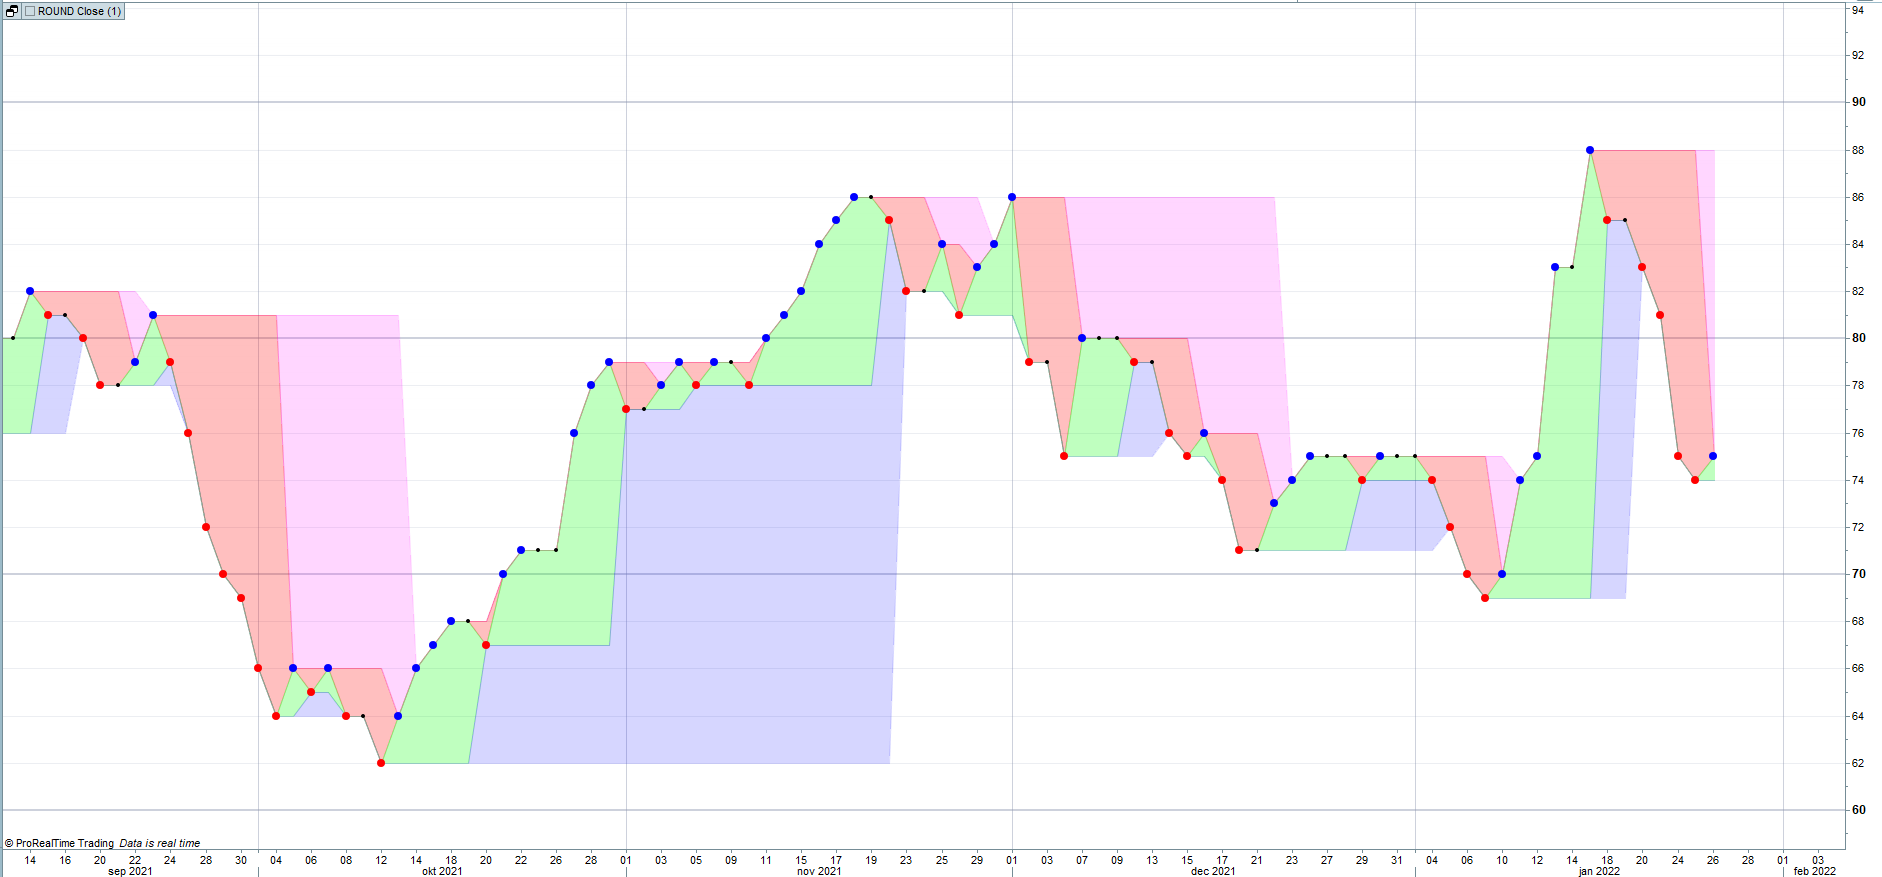
Indicator which shows a rounded price and the coloured areas help to judge if the price is increasing or decreasing on short or longterm.
p = 10

AFR = ROUND(Close / p) * p

IF AFR <= AFR[1] THEN
i = i + 1
AFR2 = AFR[i]
ELSE
i = 0
AFR2 = AFR
ENDIF

IF AFR >= AFR[1] THEN
j = j + 1
AFR3 = AFR3[j]
ELSE
j = 0
AFR3 = AFR
ENDIF

IF AFR3 >= AFR3[1] THEN
k = k + 1
AFR4 = AFR4[k]
ELSE
k = 0
AFR4 = AFR3
ENDIF

IF AFR2 <= AFR2[1] THEN
l = l + 1
AFR5 = AFR5[l]
ELSE
l = 0
AFR5 = AFR2
ENDIF

IF AFR > AFR[1] THEN
DRAWPOINT(barindex, AFR, 2)coloured(0,0,255)
ENDIF

IF AFR < AFR[1] THEN
DRAWPOINT(barindex, AFR, 2)coloured(255,0,0)
ENDIF

IF AFR = AFR[1] THEN
DRAWPOINT(barindex, AFR, 1)coloured(0,0,0)
ENDIF

RETURN Close, AFR, AFR2, AFR3, AFR4, AFR5
Download
Filename:
Coloured-Price-Bands.itf
Downloads:
92
Average
This author is like an anonymous function, present but not directly identifiable. More details on this code architect as soon as they exit 'incognito' mode.
Author’s Profile
Loading...