







The "% Bollinger in Trend" strategy
Hello everyone,
Here is a strategy that mixes the « % Bollinger » indicator, with the trend.
One of my readers made me discover an ebook of Charles Dereeper, who spoke of it. The concept does not come from him, it is well known.
But I found the idea of associating this indicator with the trend very relevant, so I tried to code this strategy.
As a reminder, the « % Bollinger » indicator is defined by :
% Bollinger = (closing price – lower Bollinger) / (upper Bollinger – lower Bollinger)
The ProRealTime indicator is coded by myself like this :
// Indicateur % Bollinger : pB
// paramères : période et déviation : libre à vous de changer ces valeurs
p = 10
dev = 1.5

BollInf = Average[p](close)-dev*std[p](close)
BollSup = Average[p](close)+dev*std[p](close)
pB = (close - BollInf) / (BollSup - BollInf)

return pB
We will associate this indicator with the trend.
In bull market, we go to purchase if :
close > MA100
MA20 > MA200
% Bollinger < 0.2 and % Bollinger < 0.2 on previous candle (consolidation)
We close the trade if :
% Bollinger > 1
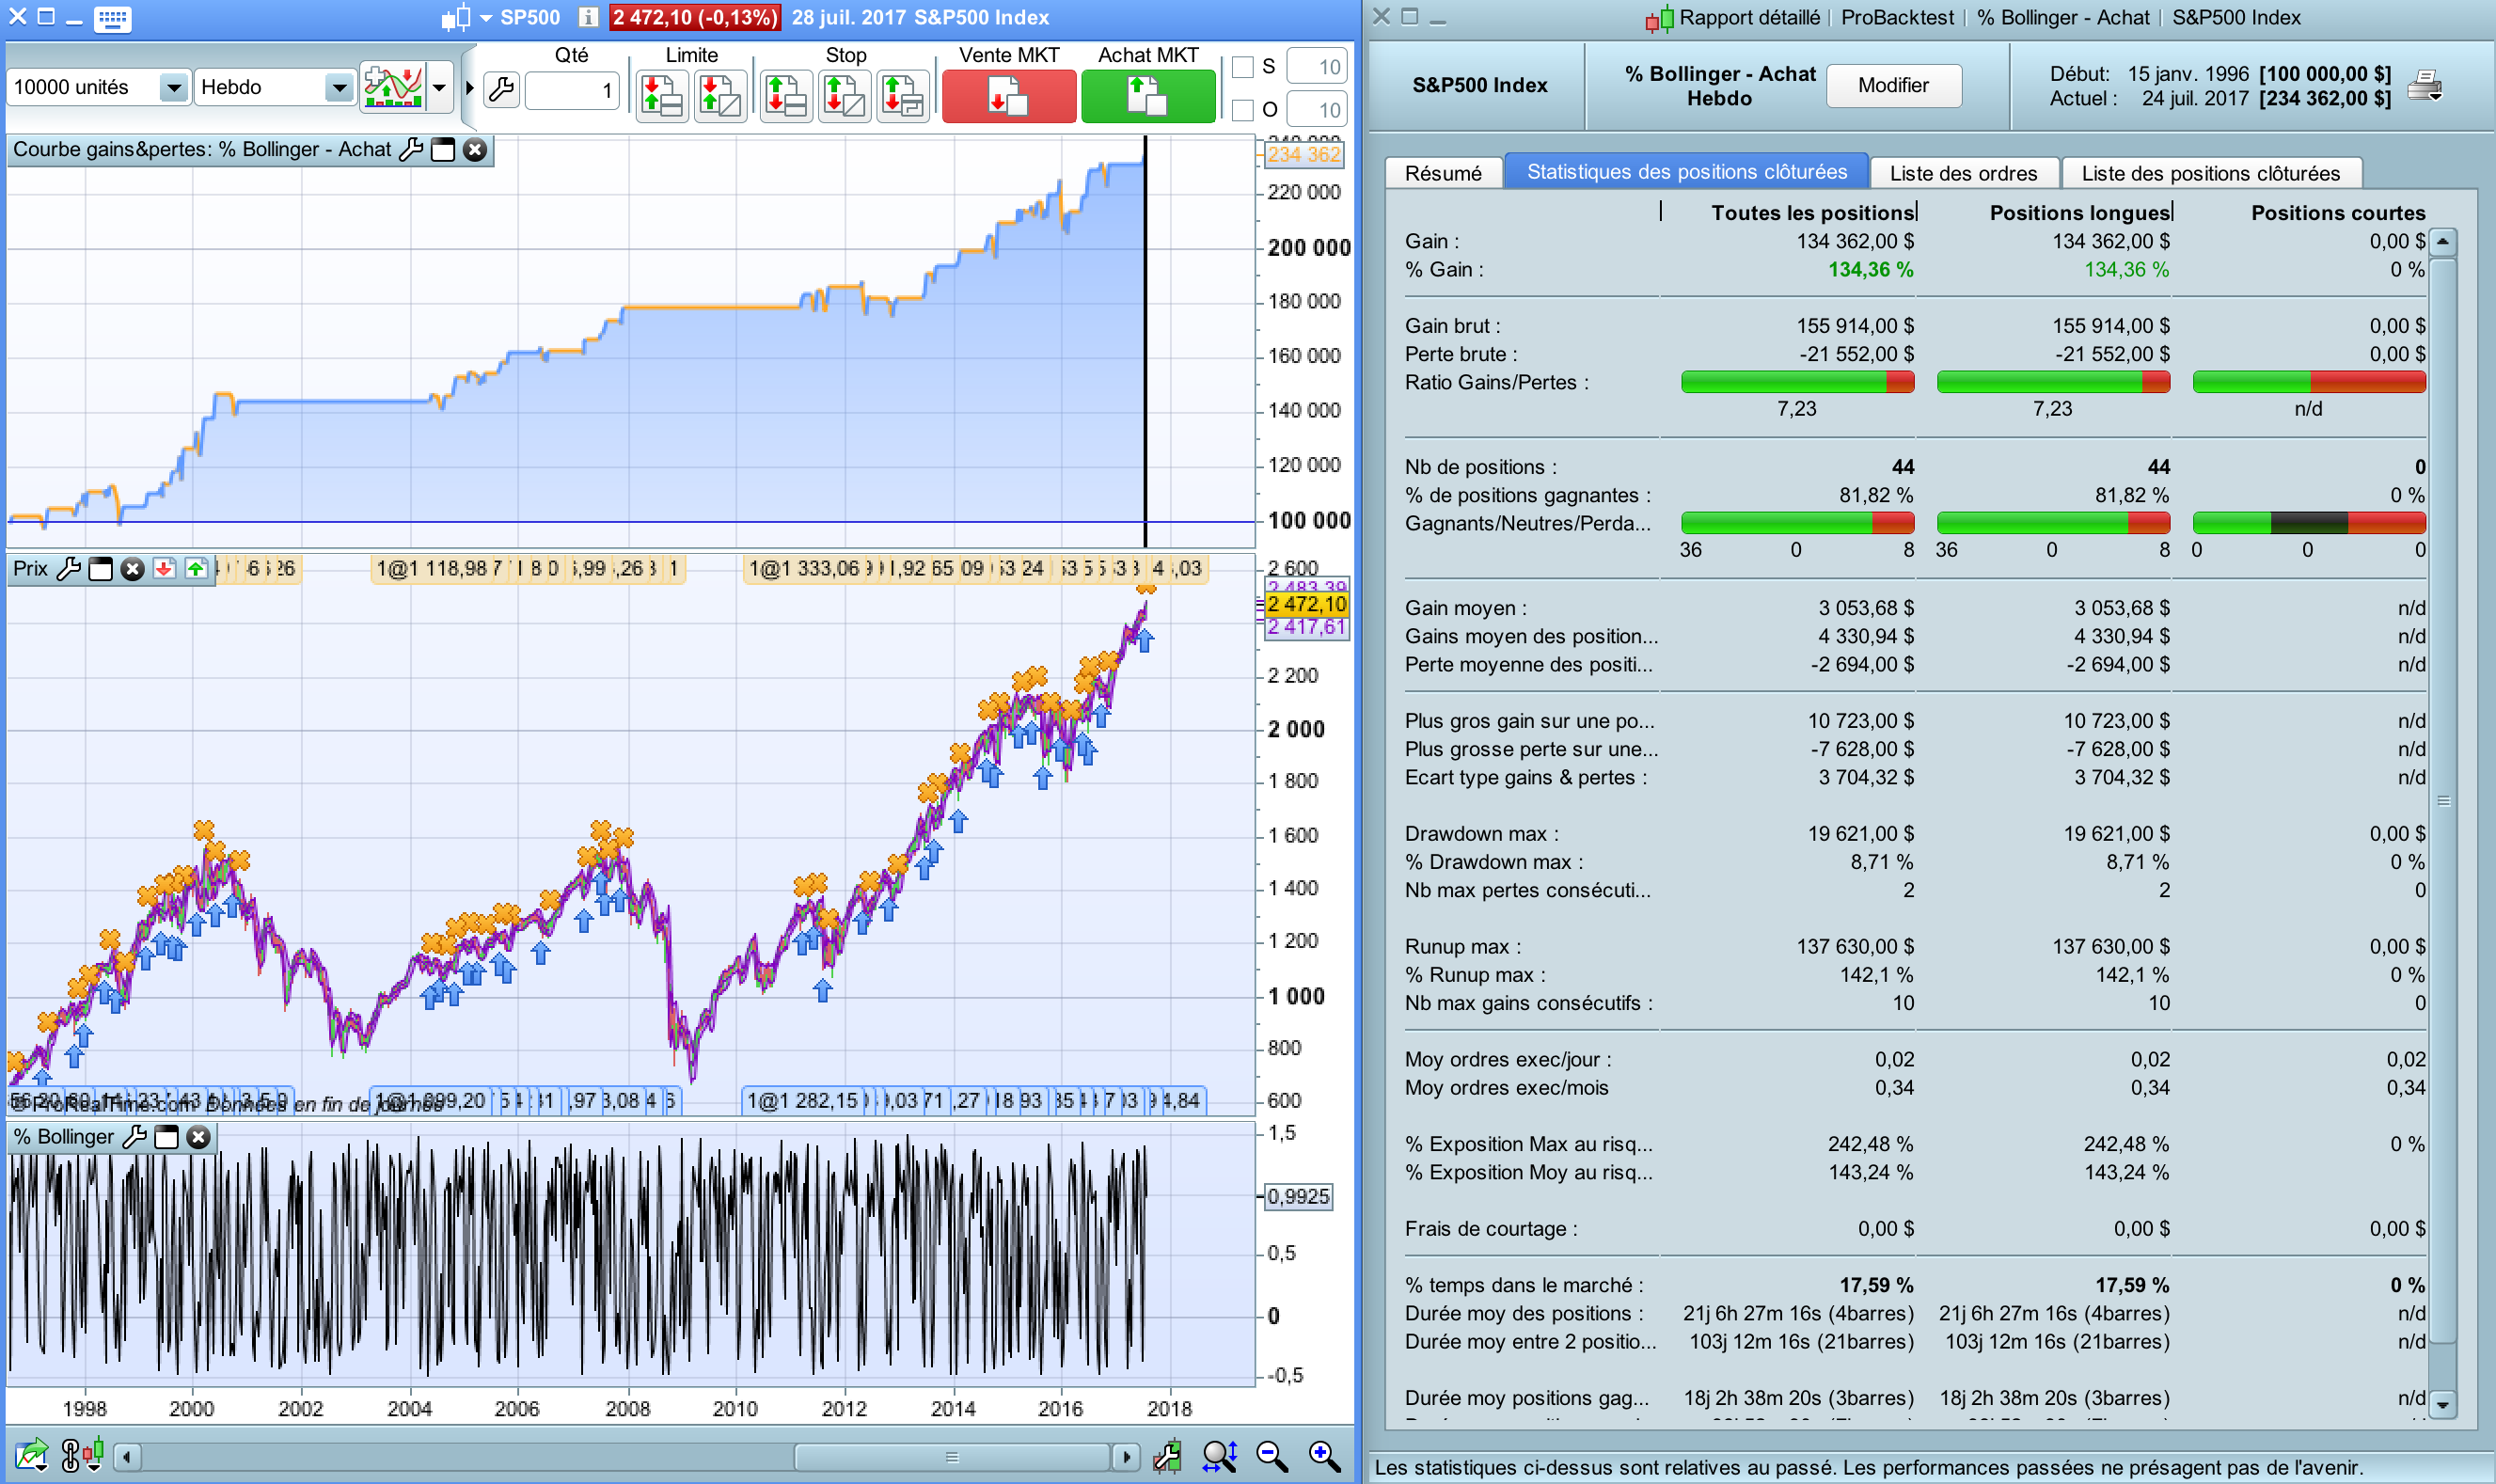
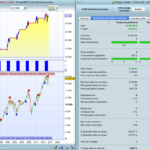
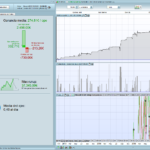
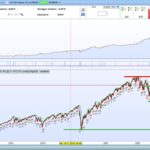
As you can see on the following test (S&P500 INDEX, daily chart, spread 1 point), the strategy is very successful in the bull market : profit factor> 7 !
However, there is very few position (very selective criterias), which means that there are not many gross profits, much less for example than the Swing S&P500 strategy that I personally use.
Quite sad, as I’m always looking for concepts that can improve my own algorithms.
Actually, it would be quite possible to attempt to adapt this strategy to short positions, but it seems less profitable.
You are free to try to improve this strategy.
On the S&P500, it was profitable.
It is quite possible that the parameters for the CAC40, the DAX, the stocks, etc. can be adapted.
It’s up to you.
Best regards and happy trading !
// % Bollinger en tendance

Defparam cumulateorders = false

// Taille des positions
n = 1

// Indicateur % Bollinger : pB
// Paramètres 5/1
BollInf = Average[5](close)-1*std[5](close)
BollSup = Average[5](close)+1*std[5](close)
pB = (close - BollInf) / (BollSup - BollInf)

// ACHAT
ca1 = close > average[100](close)
ca2 = average[20](close) > average[200](close)
ca3 = pB[1] < 0.2 and pB < 0.2

IF ca1 and ca2 and ca3 THEN
 buy n shares at market
ENDIF

// SORTIE ACHAT
IF pB crosses over 1 THEN
 sell at market
ENDIF
Comments
You must be logged in to post a comment.
AH ok, I think the ca3 is the same : ca3 = pB[1] < 0.2 and pB < 0.2 Best regards,

Hello, about this, i have problem with the code below this line """"""""ca2s = average[20](close) 1 and pB > 1"""" and i dont have ca3s could you help me? thanks // short position ca1s = close 1 IF ca1s and ca2s and ca3s THEN sellshort n shares at market ENDIF // exit short position if pB crosses under 0.2 THEN EXITSHORT at market ENDIF
Hello rejo007, I don't really understand your question. The code works fine for "long" trades. I didn't make it for "short" trades. Give us you full code and we will fix it. Best regards,

could someone make this a screener for me :) ?

// short position ca1s = close < average[100](close) ca2s = average[20](close) 1 and pB > 1 IF ca1s and ca2s and ca3s THEN sellshort n shares at market ENDIF // exit short position if pB crosses under 0.2 THEN EXITSHORT at market ENDIF

bonjour j ai un probleme avec ce code modifié, apparement PRT ne veut pas...avez vous une solution? merci
Excellent, thanks SimoneDasGupta !
Nice job! It makes good results also on DOW JONES Weekely and on DAX Daily, but also with the short.

Hello Nicolas, You're right ! I forgot to say that I wanted to make the strategy for long term trading, so I like the weekly timeframe. I wanted to join also a picture for daily timeframe, but the equity curve was more "sexy" on weekly timeframe, I could only join 1 picture. Best regards,

Thanks for sharing. The backtest is made on a weekly chart in your example (that's why PF is superior to 7). However, the strategy is also in gain on a daily timeframe. For everyone's information, SP500 Index is not a tradable instrument, this strategy must be launched on a CFD account (ticked is US 500).
Hello everybody, First, thank you so much for all your advices, I'm a begginer in trading and I think you are very helpful ! I tried to make a screener with this indicator above but it doesn't work, here is the screener as I write it : myMonindicateurBB = CALL "MonindicateurBB"(close) Trigger = myMonindicateurBB >= 1 SCREENER[trigger](myMonindicateurBB) Could anyone help me for this ! Thank's very much in advance :)