Hello,
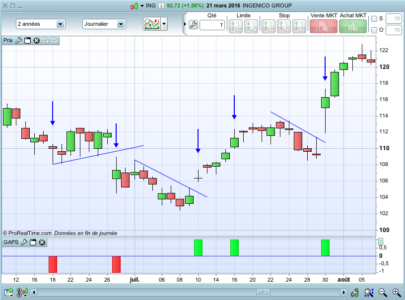
Based on 3 lines break indicator and some other pieces of code found elsewhere, I propose this strategy, with several alternative conditions of exits. An optimization variable “strategy” needs to be implemented from 1 to 9, to compare the different variations.
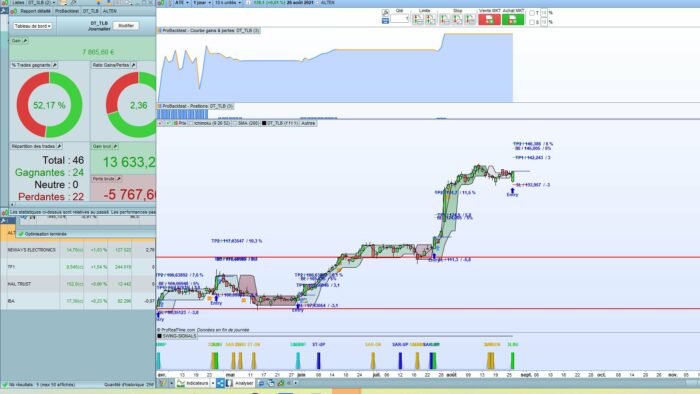
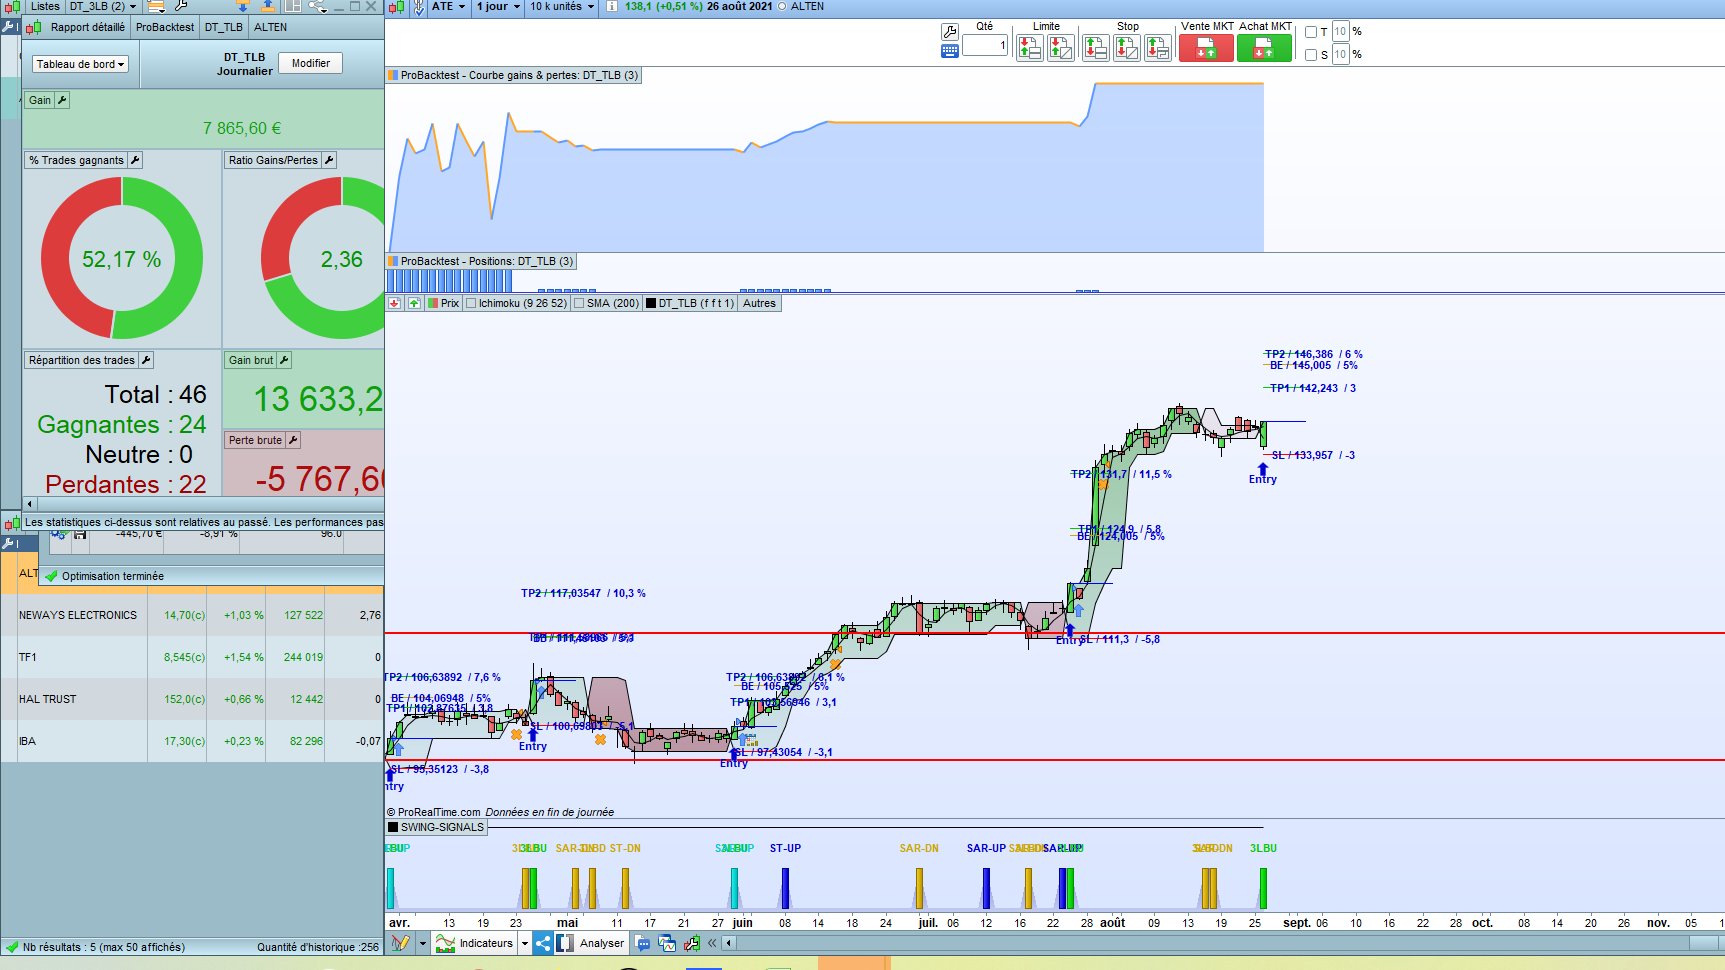
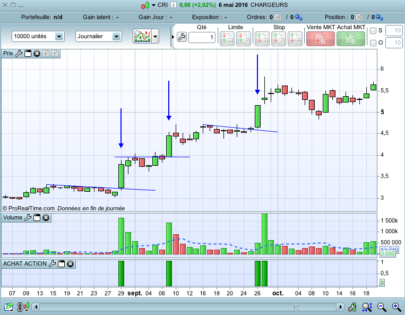
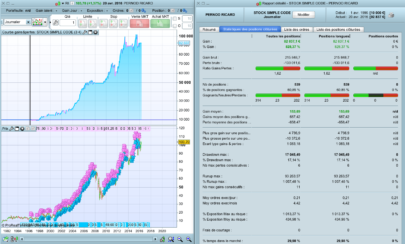
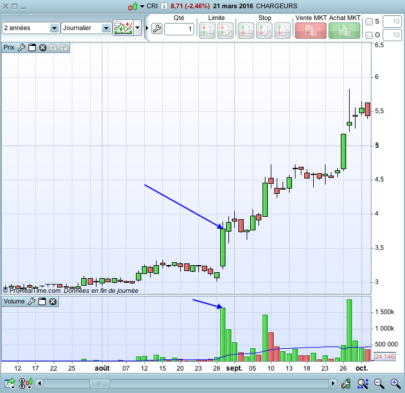
Visually winning trades look beautiful, but at the end, % of winning rates ratio is average. Profit factor is often profitable when tested on various stocks.
Would appreciate some feedback to improve the strategy. I already know that the code may look pretty messy and not optimized.
Discussions about the strategy take place in this forum topic: https://www.prorealcode.com/topic/a-strategy-around-3-lines-break-on-stocks-daily/
|
1 2 3 4 5 6 7 8 9 10 11 12 13 14 15 16 17 18 19 20 21 22 23 24 25 26 27 28 29 30 31 32 33 34 35 36 37 38 39 40 41 42 43 44 45 46 47 48 49 50 51 52 53 54 55 56 57 58 59 60 61 62 63 64 65 66 67 68 69 70 71 72 73 74 75 76 77 78 79 80 81 82 83 84 85 86 87 88 89 90 91 92 93 94 95 96 97 98 99 100 101 102 103 104 105 106 107 108 109 110 111 112 113 114 115 116 117 118 119 120 121 122 123 124 125 126 127 128 129 130 131 132 133 134 135 136 137 138 139 140 141 142 143 144 145 146 147 148 149 150 |
// @Name DT_3LineBreak // @Type Backtest // @Date: 04.08.2021 // @Source: Tradosaure Youtube + code DocTrading // @Timeframe: Daily // @Entry:Breakout 3LB reversal with trend filter (close>MA200) // @Stop Loss: 3LB low // @Take Profit: 1 SL distance (RRR) - to be tested DEFPARAM CumulateOrders=True // Sub-Strategies: // 1- TP = 1SL // 2- TP = 1.5 SL // 3- TP = 2 SL // 4- TP = 5% // 5- TBC // 6- BE after 5% // 7- TP =1.5 SL + BE 5% // 8- TP =2 SL + BE 5% // 9- BE + Trailing stop strategy = 2 ////////////////////////////////////////////////////////////////////// //// GENERIC CODE ////////////////////////////////////////////////////////////////////// // TAILLE DES POSITIONS : 3 VARIABLES A PARAMÉTRER CAPITALInit = 1000 // Capital initial (pour le calcul de taille des trades) LEVIER = 1 // Levier : ne pas en abuser, bien vérifier le drawdown REINV = 0 // 0 = sans réinvestir / 1 = réinvestir les gains RISQ = 0.01 distSL = 0.04 // minimum stop loss distance % to be profitable RRR=1 // Risk Reward Ratio if strategy = 2 or strategy =7 then RRR=1.5 elsif strategy = 3 or strategy = 8 then RRR=2 endif IF REINV = 0 THEN n = round((CapitalInit / close) * levier) ELSIF REINV = 1 THEN capital = (CAPITALinit + strategyprofit) n = round((capital/close) * levier) ENDIF ////////////////////////////////////////////////////////////////////// //// INDICATOR ////////////////////////////////////////////////////////////////////// once t=1 once a0=(close) once a1=(close) once a2=(close) once a3=(close) newClose = close if t=1 and newClose>a3 then a0=a1 a1=a2 a2=a3 a3=newClose elsif t=1 and newClose<a0 then t=-1 a1=a3 a0=a3 a3=newClose elsif t=-1 and newClose<a3 then a0=a1 a1=a2 a2=a3 a3=newClose elsif t=-1 and newClose>a0 then t=1 a1=a3 a0=a3 a3=newClose cBuy=1 else cBuy=0 endif ////////////////////////////////////////////////////////////////////// //// BUY CONDITIONS ////////////////////////////////////////////////////////////////////// i=0 c1 = cBuy ma50=Average[50](close) c2 = ma50>ma50[1] or close>ma50 //c2 = close>Average[200](close) c0=1 if not longonmarket and c0 and c1 and c2 then BUY n shares at market nextbaropen sellprice = min(high*(1-distSL-0.001),a0) targetprice = high+RRR*(high-sellprice) if strategy = 4 then targetprice = high*1.05 endif ENDIF ////////////////////////////////////////////////////////////////////// //// BREAK EVEN ////////////////////////////////////////////////////////////////////// IF NOT ONMARKET THEN breakevenLevel=0 ENDIF //test if the price have moved favourably of "startBreakeven" points already IF strategy >5 then IF LONGONMARKET AND high>1.05*tradeprice(1) THEN //calculate the breakevenLevel breakevenLevel = tradeprice(1)*1.02 ENDIF endif //place the new stop orders on market at breakevenLevel IF breakevenLevel>0 THEN SELL AT breakevenLevel STOP ENDIF ////////////////////////////////////////////////////////////////////// //// REBUY ////////////////////////////////////////////////////////////////////// if longonmarket and cBuy[0] and t[1]=-1 then BUY n shares at market nextbaropen endif ////////////////////////////////////////////////////////////////////// //// SELL CONDITIONS ////////////////////////////////////////////////////////////////////// IF longonmarket THEN cSell = close < sellprice or close > targetprice if strategy=9 then cSell = close<a0 endif IF cSell THEN SELL at market nextbaropen ENDIF ENDIF |
Share this
No information on this site is investment advice or a solicitation to buy or sell any financial instrument. Past performance is not indicative of future results. Trading may expose you to risk of loss greater than your deposits and is only suitable for experienced investors who have sufficient financial means to bear such risk.
ProRealTime ITF files and other attachments :
Find other exclusive trading pro-tools on ![]()
PRC is also on YouTube, subscribe to our channel for exclusive content and tutorials


Looks great, personally I don’t use automated trading for single stocks, but is definitely on my to do list.
Good results in emerging companies.
Backtested it in many forex but didn’t find solid results.
Thanks for sharing!
Ciao,
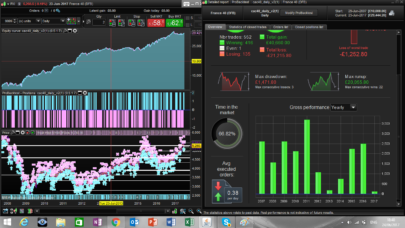
I look that the strategy (backtest 50 k), works very good wiht US 500 CASH 1 EURO in 4 h time frame.
i made the following changes:
DEFPARAM CumulateOrders=false
strategy = 5
n=5 (size 5) I do not use the size it increases
ma50=Average[30](close)
/ @Name DT_3LineBreak
// @Type Backtest
// @Date: 04.08.2021
// @Source: Tradosaure Youtube + code DocTrading
// @Timeframe: Daily
// @Entry:Breakout 3LB reversal with trend filter (close>MA200)
// @Stop Loss: 3LB low
// @Take Profit: 1 SL distance (RRR) – to be tested
DEFPARAM CumulateOrders=false
// Sub-Strategies:
// 1- TP = 1SL
// 2- TP = 1.5 SL
// 3- TP = 2 SL
// 4- TP = 5%
// 5- TBC
// 6- BE after 5%
// 7- TP =1.5 SL + BE 5%
// 8- TP =2 SL + BE 5%
// 9- BE + Trailing stop
strategy = 6.50
//////////////////////////////////////////////////////////////////////
//// GENERIC CODE
//////////////////////////////////////////////////////////////////////
// TAILLE DES POSITIONS : 3 VARIABLES A PARAMÉTRER
//CAPITALInit = 10000
// Capital initial (pour le calcul de taille des trades)
LEVIER = 1
// Levier : ne pas en abuser, bien vérifier le drawdown
//REINV = 0
// 0 = sans réinvestir / 1 = réinvestir les gains
RISQ = 0.015
distSL = 0.04 // minimum stop loss distance % to be profitable
RRR=1 // Risk Reward Ratio
if strategy = 2 or strategy =7 then
RRR=1.5
elsif strategy = 3 or strategy = 8 then
RRR=2
endif
n=6.50
//////////////////////////////////////////////////////////////////////
//// INDICATOR
//////////////////////////////////////////////////////////////////////
once t=1
once a0=(close)
once a1=(close)
once a2=(close)
once a3=(close)
newClose = close
if t=1 and newClose>a3 then
a0=a1
a1=a2
a2=a3
a3=newClose
elsif t=1 and newClose<a0 then
t=-1
a1=a3
a0=a3
a3=newClose
elsif t=-1 and newClose<a3 then
a0=a1
a1=a2
a2=a3
a3=newClose
elsif t=-1 and newClose>a0 then
t=1
a1=a3
a0=a3
a3=newClose
cBuy=1
else
cBuy=0
endif
//////////////////////////////////////////////////////////////////////
//// BUY CONDITIONS
//////////////////////////////////////////////////////////////////////
i=0
c1 = cBuy
ma50=Average[30](close)
c2 = ma50>ma50[1] or close>ma50
//c2 = close>Average[200](close)
c0=1
if not longonmarket and c0 and c1 and c2 then
BUY n shares at market nextbaropen
sellprice = min(high*(1-distSL-0.001),a0)
targetprice = high+RRR*(high-sellprice)
if strategy = 4 then
targetprice = high*1.05
endif
ENDIF
//////////////////////////////////////////////////////////////////////
//// BREAK EVEN
//////////////////////////////////////////////////////////////////////
IF NOT ONMARKET THEN
breakevenLevel=0
ENDIF
//test if the price have moved favourably of “startBreakeven” points already
IF strategy >5 then
IF LONGONMARKET AND high>1.05*tradeprice(1) THEN
//calculate the breakevenLevel
breakevenLevel = tradeprice(1)*1.02
ENDIF
endif
//place the new stop orders on market at breakevenLevel
IF breakevenLevel>0 THEN
SELL AT breakevenLevel STOP
ENDIF
//////////////////////////////////////////////////////////////////////
//// REBUY
//////////////////////////////////////////////////////////////////////
if longonmarket and cBuy[0] and t[1]=-1 then
BUY n shares at market nextbaropen
endif
//////////////////////////////////////////////////////////////////////
//// SELL CONDITIONS
//////////////////////////////////////////////////////////////////////
IF longonmarket THEN
cSell = close < sellprice or close > targetprice
if strategy=9 then
cSell = close<a0
endif
IF cSell THEN
SELL at market nextbaropen
ENDIF
ENDIF
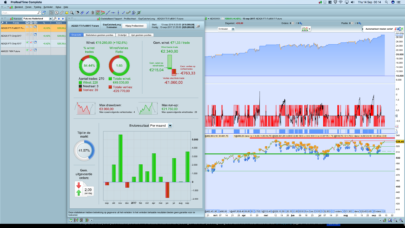
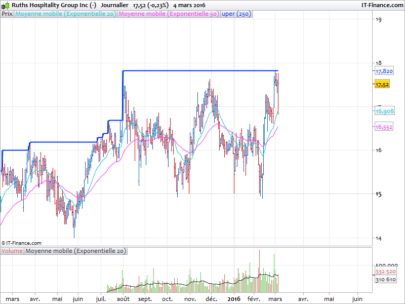
The equity curve looks to follow the stock price almost perfectly, Have you tested on stock that is in a down trend? I have found that to be effective for teaching the system when not to trade, for example I will forbid a system to take Long entries below yesterdays low or some other fail safe, to limit losses and drawdowns, just a suggestion, I havent read or tried to understand the code itself I just find if the equity curve follows the price you are essentially a bag holder.
Averaging in and out can help improve win rate eg, below a basic and rough example of effective way to average
INPROFIT = close[1] > (POSITIONPRICE[1]+(POINTSIZE*2))
If C1 THEN
BUY 5 XXXX at market
ELSIF C2 AND COUNT OF POSITION >5 Then
Buy 5 SHARES AT MARKET
ENDIF
IF EX1 AND INPROFIT
THEN SELL 5 XXXX AT MARKET
ELSIF EX2 AND NOT INPROFIT THEN
SELL 5 XXXX AT MARKET
ENDIF