3 lines break reversal strategy on trending stocks

3 lines break reversal strategy on trending stocks

Hello,

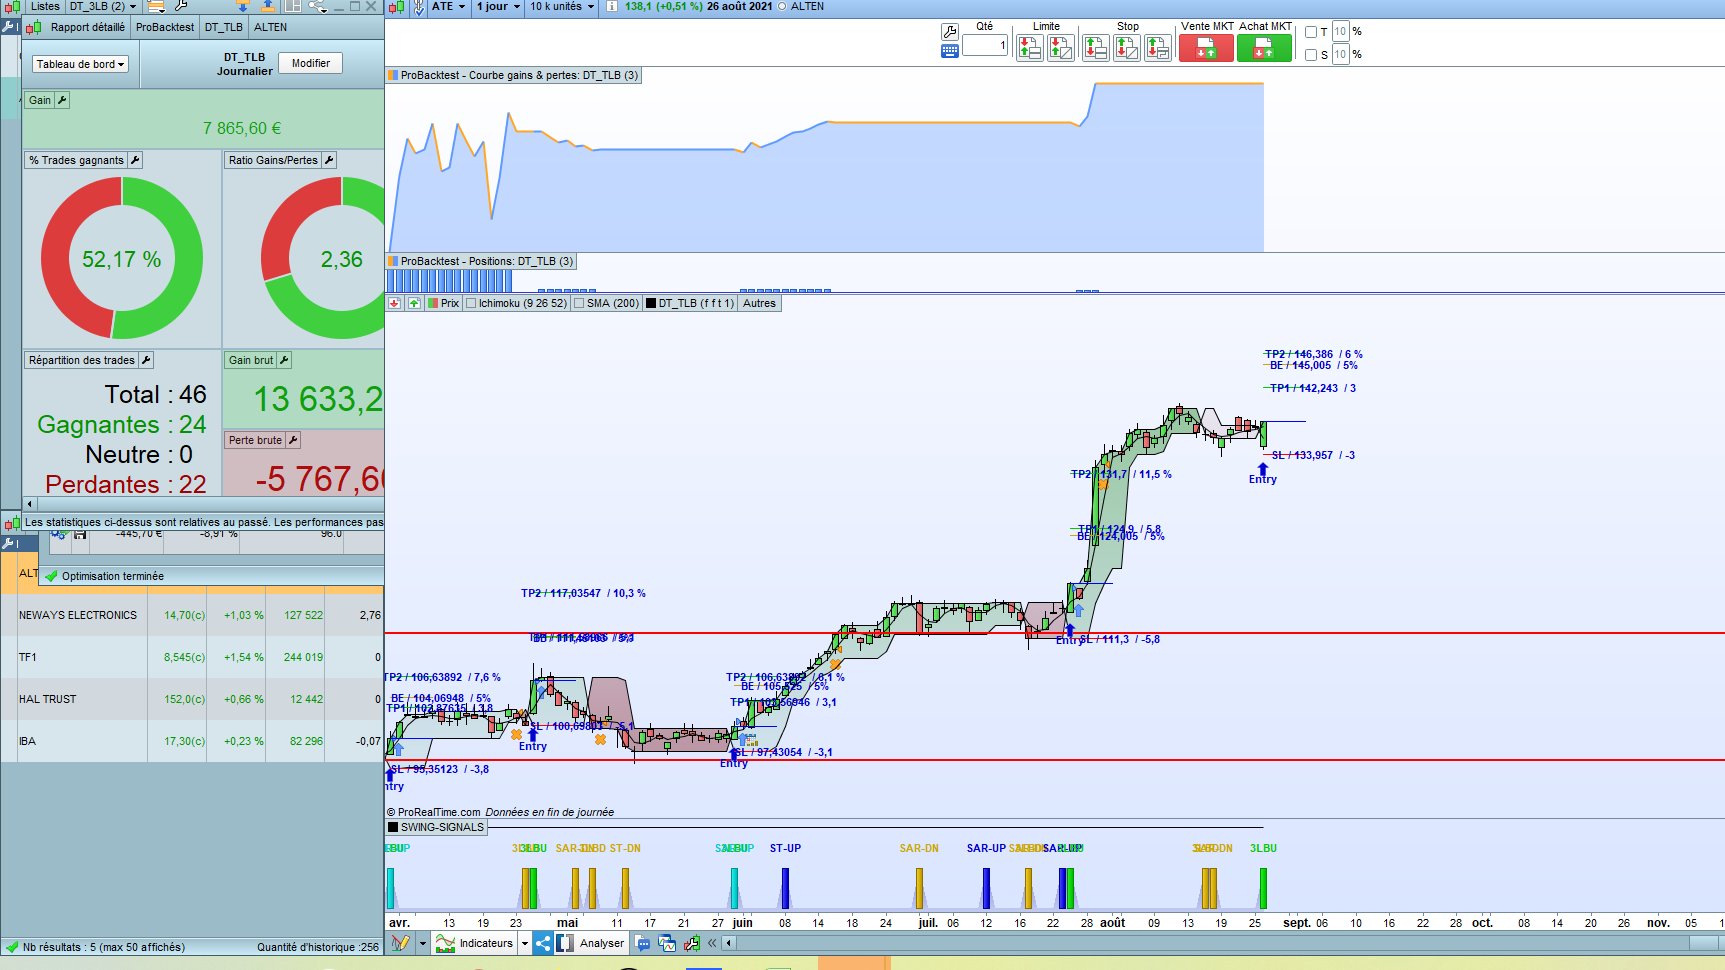
Based on 3 lines break indicator and some other pieces of code found elsewhere, I propose this strategy, with several alternative conditions of exits. An optimization variable “strategy” needs to be implemented from 1 to 9, to compare the different variations.

Visually winning trades look beautiful, but at the end, % of winning rates ratio is average. Profit factor is often profitable when tested on various stocks.

Would appreciate some feedback to improve the strategy. I already know that the code may look pretty messy and not optimized.

Discussions about the strategy take place in this forum topic: https://www.prorealcode.com/topic/a-strategy-around-3-lines-break-on-stocks-daily/

Share this

Risk disclosure:

No information on this site is investment advice or a solicitation to buy or sell any financial instrument. Past performance is not indicative of future results. Trading may expose you to risk of loss greater than your deposits and is only suitable for experienced investors who have sufficient financial means to bear such risk.

ProRealTime ITF files and other attachments : How to import ITF files into ProRealTime platform?

PRC is also on YouTube, subscribe to our channel for exclusive content and tutorials

  1. emism12 • 08/30/2021 #

    Looks great, personally I don’t use automated trading for single stocks, but is definitely on my to do list.
    Good results in emerging companies.
    Backtested it in many forex but didn’t find solid results.

    Thanks for sharing!

  2. adconsulting • 08/30/2021 #

    Ciao,
    I look that the strategy (backtest 50 k), works very good wiht US 500 CASH 1 EURO in 4 h time frame.
    i made the following changes:

    DEFPARAM CumulateOrders=false
    strategy = 5
    n=5 (size 5) I do not use the size it increases
    ma50=Average[30](close)

    / @Name DT_3LineBreak
    // @Type Backtest
    // @Date: 04.08.2021
    // @Source: Tradosaure Youtube + code DocTrading
    // @Timeframe: Daily
    // @Entry:Breakout 3LB reversal with trend filter (close>MA200)
    // @Stop Loss: 3LB low
    // @Take Profit: 1 SL distance (RRR) – to be tested

    DEFPARAM CumulateOrders=false

    // Sub-Strategies:
    // 1- TP = 1SL
    // 2- TP = 1.5 SL
    // 3- TP = 2 SL
    // 4- TP = 5%
    // 5- TBC
    // 6- BE after 5%
    // 7- TP =1.5 SL + BE 5%
    // 8- TP =2 SL + BE 5%
    // 9- BE + Trailing stop
    strategy = 6.50

    //////////////////////////////////////////////////////////////////////
    //// GENERIC CODE
    //////////////////////////////////////////////////////////////////////

    // TAILLE DES POSITIONS : 3 VARIABLES A PARAMÉTRER
    //CAPITALInit = 10000
    // Capital initial (pour le calcul de taille des trades)
    LEVIER = 1
    // Levier : ne pas en abuser, bien vérifier le drawdown
    //REINV = 0
    // 0 = sans réinvestir / 1 = réinvestir les gains

    RISQ = 0.015
    distSL = 0.04 // minimum stop loss distance % to be profitable

    RRR=1 // Risk Reward Ratio
    if strategy = 2 or strategy =7 then
    RRR=1.5
    elsif strategy = 3 or strategy = 8 then
    RRR=2
    endif

    n=6.50
    //////////////////////////////////////////////////////////////////////
    //// INDICATOR
    //////////////////////////////////////////////////////////////////////

    once t=1
    once a0=(close)
    once a1=(close)
    once a2=(close)
    once a3=(close)

    newClose = close
    if t=1 and newClose>a3 then
    a0=a1
    a1=a2
    a2=a3
    a3=newClose
    elsif t=1 and newClose<a0 then
    t=-1
    a1=a3
    a0=a3
    a3=newClose
    elsif t=-1 and newClose<a3 then
    a0=a1
    a1=a2
    a2=a3
    a3=newClose
    elsif t=-1 and newClose>a0 then
    t=1
    a1=a3
    a0=a3
    a3=newClose
    cBuy=1
    else
    cBuy=0
    endif

    //////////////////////////////////////////////////////////////////////
    //// BUY CONDITIONS
    //////////////////////////////////////////////////////////////////////

    i=0
    c1 = cBuy
    ma50=Average[30](close)
    c2 = ma50>ma50[1] or close>ma50
    //c2 = close>Average[200](close)
    c0=1

    if not longonmarket and c0 and c1 and c2 then
    BUY n shares at market nextbaropen
    sellprice = min(high*(1-distSL-0.001),a0)
    targetprice = high+RRR*(high-sellprice)
    if strategy = 4 then
    targetprice = high*1.05
    endif
    ENDIF

    //////////////////////////////////////////////////////////////////////
    //// BREAK EVEN
    //////////////////////////////////////////////////////////////////////
    IF NOT ONMARKET THEN
    breakevenLevel=0
    ENDIF

    //test if the price have moved favourably of “startBreakeven” points already
    IF strategy >5 then
    IF LONGONMARKET AND high>1.05*tradeprice(1) THEN
    //calculate the breakevenLevel
    breakevenLevel = tradeprice(1)*1.02
    ENDIF
    endif

    //place the new stop orders on market at breakevenLevel
    IF breakevenLevel>0 THEN
    SELL AT breakevenLevel STOP
    ENDIF

    //////////////////////////////////////////////////////////////////////
    //// REBUY
    //////////////////////////////////////////////////////////////////////
    if longonmarket and cBuy[0] and t[1]=-1 then
    BUY n shares at market nextbaropen
    endif

    //////////////////////////////////////////////////////////////////////
    //// SELL CONDITIONS
    //////////////////////////////////////////////////////////////////////

    IF longonmarket THEN
    cSell = close < sellprice or close > targetprice
    if strategy=9 then
    cSell = close<a0
    endif
    IF cSell THEN
    SELL at market nextbaropen
    ENDIF
    ENDIF

  3. Kev Monaghan • 08/30/2021 #

    The equity curve looks to follow the stock price almost perfectly, Have you tested on stock that is in a down trend? I have found that to be effective for teaching the system when not to trade, for example I will forbid a system to take Long entries below yesterdays low or some other fail safe, to limit losses and drawdowns, just a suggestion, I havent read or tried to understand the code itself I just find if the equity curve follows the price you are essentially a bag holder.
    Averaging in and out can help improve win rate eg, below a basic and rough example of effective way to average

    INPROFIT = close[1] > (POSITIONPRICE[1]+(POINTSIZE*2))

    If C1 THEN
    BUY 5 XXXX at market
    ELSIF C2 AND COUNT OF POSITION >5 Then
    Buy 5 SHARES AT MARKET
    ENDIF

    IF EX1 AND INPROFIT
    THEN SELL 5 XXXX AT MARKET
    ELSIF EX2 AND NOT INPROFIT THEN
    SELL 5 XXXX AT MARKET
    ENDIF

avatar
Register or

Likes

avatar avatar avatar avatar avatar avatar avatar avatar avatar avatar avatar avatar avatar avatar
Related users ' posts
YvesRobert Hello daviddelaferla. Ok, but to optimize period and mode, filter1 and filter2 must be 0 or ...
davidelaferla Hello YvesRobert! To optimize period and mode, filter1 and filter2 must be 0
Germano77 hello, thx for sharing, but wich broker do you use? At IG I got the notification "automatic...
Ciccarelli Franco Hai ragione, mi dava valori alti perchè usavo questo loss "SET STP LOSS 1xAverageTrueRange{1...
YvesRobert Hello davidelaferla, how do you put a stop loss and where exactly ? the moment you enter on ...
Hypersimo Buongiorno Davide a quale distanza inserire stop loss e tp nella strategia? grazie
luxrun Hi Josè I can't load the itf calculated tool. The platform gives me an error "incorrect form...
Stanley
11 months ago
Amazon / Alibaba
Amazon / Alibaba
0
Calculated instruments
Nicolas
11 months ago
BoutDePain Here is the updated screener with variables that are more understandable:
BoutDePain https://www.prorealcode.com/topic/three-line-breakouts/#post-155918
haimpinto Hi What should be added in the code in order to limit the price range of the shares it disp...
smarttrader1 hi, can you improve on this ? can you make this flag screeener for day trading, I want to be...
Nicolas Please open a new topic in the proscreener forum for this specific query. Please provide exp...
NHGambler Nice screener. Only thing is I wonder if this is aimed more at small/medium/large caps? I ...
mickey992 salut merci pour ton partage et ton travaille
patapouf Hi Vivien René I just discovered your “Ordered trend-following stocks Screener”. Great work...
RobertFX Works fine
Kees Pols great tool! Thank you
tush1822 appreciate your post mate!! it helped me.
fredfilm Hi Nicolas, how could we add a price screen to this? eg stock prices between $1 to $3 etc
avatar
Anonymous Hi Odin, Thanks for this screener based on the popular criteria to trade trends from Marc...
Despair What do you mean by “German extra stocks”?
odin i mean german xetra stocks :-)
Despair Ok! Thanks.
Mully Bonjour, est ce que quelqu'un sait comment ajouter les niveaux de résistances / supports su...
Nicolas Il s'agit de l'indicateur "volume par niveau de prix" disponible par défaut dans la plateforme.
Actabi Thank you ! Have you realised your "next step" ?
Jessar guten Tag, gibt es bereits die Aktualisierte Datei?
Per Inge Gents - An update - I have been studying various trading approaches, as this one that is bas...
Gianluca thank you very nice screener
Vonasi An interesting idea that was easily turned into a strategy on a shorter time frame that appe...
Stenozar Hi Vonasi, is it possible for you to share your code here? thanks in advance
Vonasi Sorry Stenozar. I have only really spent an hour or so on this strategy so far and it is far...

Top