The “BUY Stock” screener

The “BUY Stock” screener

Hello fellow traders,

Here is a simple but very effective screener code of my own.
It detects the stocks that can be purchased.
These stocks must show some conditions, of course.
But it is not sufficient.
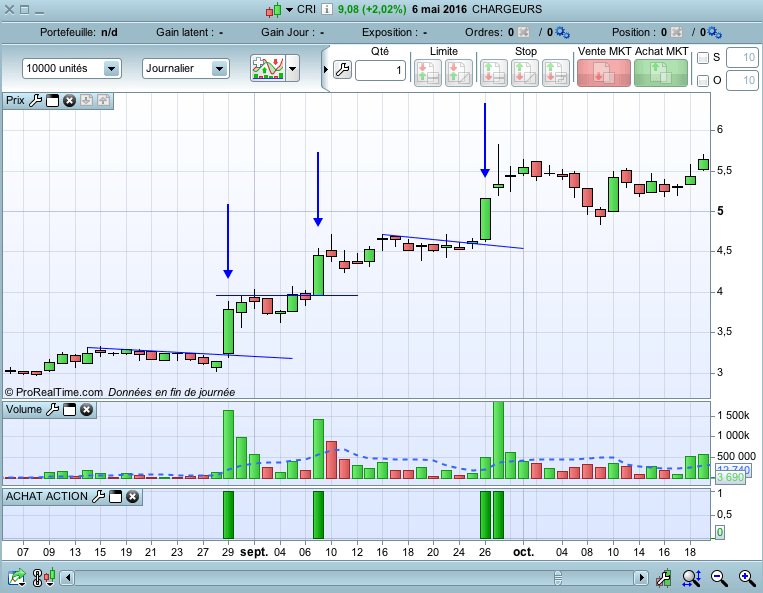
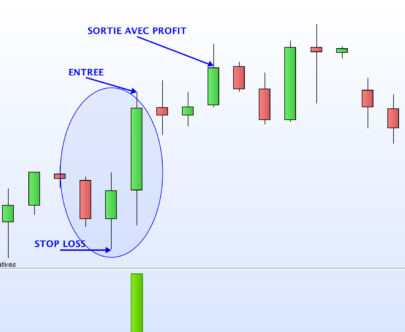
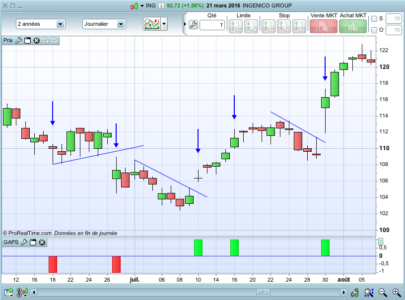
They must BREAK a TRENDLINE (a resistance).

And no code will detect this for you. That’s why we can’t backtest this kind of strategy. But it easy to make a screener, and an indicator.

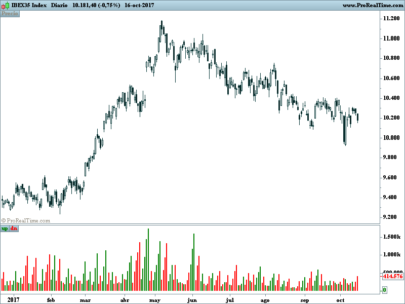
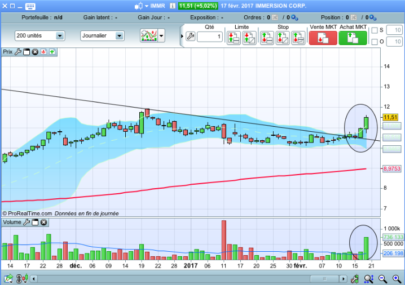
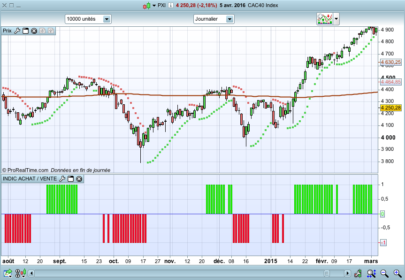
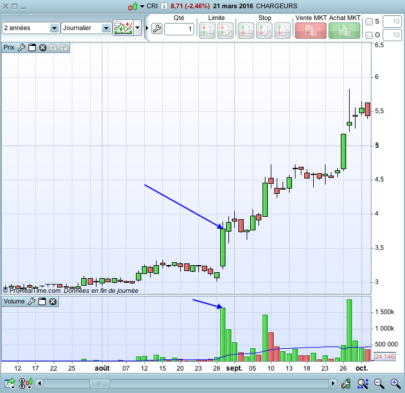
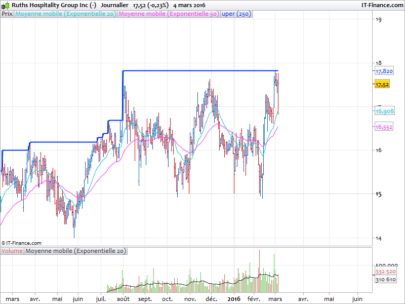
On the graphic, I did set the volumes, and the 10 average volumes.

I also show you some trendlines breaks on the same stock.

Share this

Risk disclosure:

No information on this site is investment advice or a solicitation to buy or sell any financial instrument. Past performance is not indicative of future results. Trading may expose you to risk of loss greater than your deposits and is only suitable for experienced investors who have sufficient financial means to bear such risk.

ProRealTime ITF files and other attachments : How to import ITF files into ProRealTime platform?

PRC is also on YouTube, subscribe to our channel for exclusive content and tutorials

  1. Nicolas • 05/08/2016 #

    Thanks Doc. If you want to test if your big candle have made a good move and have pierced a trendline, maybe you could just make a lookback with a simple loop in the previous candles and test if these ones were in a narrow range? Look for their highest and lowest values or average their prices to find the distance within the close of your big candle.

  2. Doctrading • 05/08/2016 #

    Hello, Nicolas.
    Yes, I did also think that it is possible : 

    add a criteria of candle size (with ADX, etc.)
    add a breakout of the 10 last high
    etc.

    But I think the best indicator is how do you see the candle. 
    If someone wants some more criteria, it is always possible.
    Best Regards, 

  3. Julien Krs • 05/08/2016 #

    Salut doc, pas moyen d’avoir un signal, j’ai beau screener tout le marché en Daily et Hebdo, je n’ai jamais le critère “1”

  4. Al Wikah • 05/08/2016 #

    Bonjour,
    Aucun retour de résultats
    Pour avoir des résultats j’ai commenté cette ligne :
    // c4 = Volume > 2*(Average[10](Volume))

  5. Al Wikah • 05/08/2016 #

    Sorry,
    l’indicateur fonctionne.
    Je n’avais pas vu les dernières lignes de commentaires
    Merci

  6. pata_tony • 05/08/2016 #

    Hi, i’m not able to see the indicator. Could you please help me? Thanks

    • Nicolas • 05/08/2016 #

      This is not an indicator but a screener, to be used with the ProScreener module.

  7. JOKAMAURICE • 05/08/2016 #

    Le programme ne se charge pas dans PRT

avatar
Register or

Likes

avatar avatar avatar avatar avatar avatar avatar avatar avatar avatar avatar avatar avatar avatar avatar avatar
Related users ' posts
Giuseppe68 ciao, ho provato l'indicatore e mi sembra interessante, ma in fase di backtest non riesco ad...
poldoposta veramente bello.....complimenti
rb-72 5 Minutes, 15 Minutes, The most effective 1 Hour below 0 or above 0 as a turn signal in the ...
Andraxx Interpretación de el indicador??? Gracias
TAC Bolsa Oscilador que hace una medición ponderara basado en la distancia entre precio y una media Mó...
julien1978 changing the trendDetectionLength setting does not seem to have any effect on the wave calcu...
arran i can't seem to get this indicator to work on forex pairs. it works great on indices etc. An...
Nicolas Indicator needs Volume, and there are no volumes with forex pairs with IG.
bertrandpinoy BONJOUR PAUL impossible de tenter le trading automatique, PRT me dis que l instruction "GRAP...
Paul Bonjour, supprimez les lignes avec un "graph"
bertrandpinoy merci. vous l utiliser actuellment sur quel instrument vous? et quel timeframe? Merci
Doctrading Hello, Higher timeframes are better. I suggest D1 or H4.Best regards,
Pinkybouh hello, I propose to add another conditions: ie: haussier: close > open and close >...
TheHovisTrader I'd be interested in the actual profit of this - in the example the stop range is at least 2...
Lyam Pareil ne marche pas dommage
ahmedbouaziz89 Bonjour, quand j'ajoute le code ou le fichier dans l'outils screeners de Prorealtime je ne v...
tyvix Bonjour le code marche bien c est juste qu'il n y a pas d opportunité au moment ou vous le...
Julio Hi Doctrading, Is it possible to flip this to a "going bearish" by simply switching the cod...
Doctrading Hello, Yes, you can do it very simply...
Tarek Laaroussi Hi doctrading i am the one who sent you the email first thanks for the code . It really wo...
Doctrading @ Rikke, Beware of such an indicator. It's just an indicator, not a trading system. You ca...
parsons40 Hello, All. Can anyone inform me how the above binary indicator or any similar indicator co...
sixtofer Hola, me gustó mucho este indicador. Pero, a la hora de instalarlo me da error en la línea 4...
RobHansson Thanks for this screener. I would like the tool removed the shares that have been on the lis...
davidspain hello doctor!! amazing job. I would like to ask u if it is possible to create an indicator ...
GABRIELE1976 bonjour, je voudrais utiliser ce screener pour trouver les titres qui, à l’ouverture de la j...
Doctrading
8 years ago
Gaps screener
Gaps screener
14
Screeners
jbox Bonjour,   Je souhaite affiché affiché les gap sur le graph des prix directement J'a...
owes29 Hi what do you find are the best settings for intraday trading regards Lee  
rille66 Hi doctrading. If you wan't to change the screener to register the gap open in realtime so y...
EAxelsson Hi, shouldn´t it be or instead of and? if FiftyTwoWeekHigh = FiftyTwoWeekHigh[1] OR FiftyTwo...
qigley Line 4 has a redundant term "Close>EMA2." is not necessary as EMA2 will always be less t...
Mike.44 Thanks It a good job !

Top