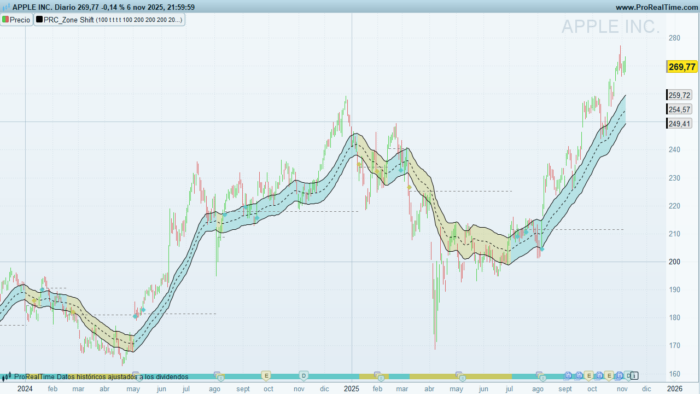
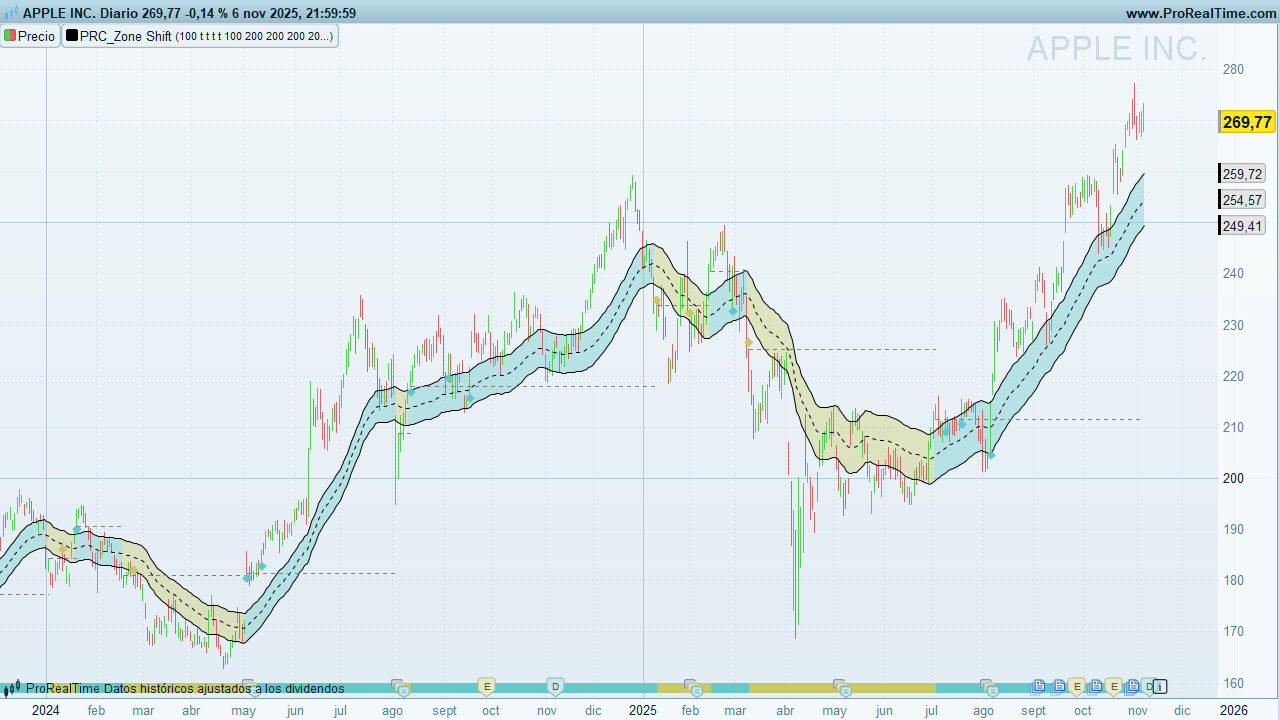
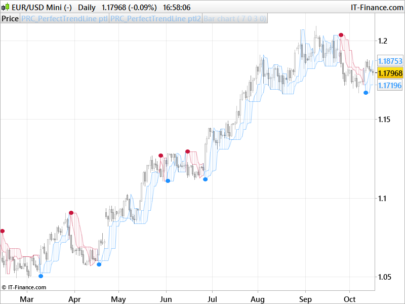
What is Zone Shift?
Zone Shift is a trend-and-channel indicator designed for clear, actionable context. It highlights when price escapes a dynamic envelope and then retests the breakout level. The tool works across timeframes:
-
Swing & positional: clean visual structure and reliable “zone memory.”
-
Intraday: responsive enough for trend days; still mindful of retests.
Use it to:
-
Confirm trend bias (green/red candles).
-
Track dynamic zones (top/bottom bands).
-
Spot retests of the trend-start level (diamond signals) that often precede continuation.
How it works
-
Core averages
-
ema: an exponential-style average ofcloseusinglength(user-driven). -
hma: a faster, HMA-like average usingmax(20, length − 40)for the period. -
Middle line (
mid) = average ofemaandhma.
-
-
Dynamic distance
-
dist= simple average of the true bar range(high − low)over 200 bars. -
Top (
itop) =mid + dist; Bottom (ibot) =mid − dist.
-
-
Trend flip logic
-
Bull flip: when the low closes above
itopwhile the prior bar’s low was below the prioritop.
→trend = 1,trendStart = low, candles turn green. -
Bear flip: when the high falls below
ibotwhile the prior bar’s high was above the prioribot.
→trend = 0,trendStart = high, candles turn red.
-
-
Retest logic (⯁)
-
After a flip, the indicator tracks the trend-start level (
trendStart). -
Bull trend: prints a green ⯁ when price crosses back above
trendStart. -
Bear trend: prints a red ⯁ when price crosses back below
trendStart. -
Markers are spaced by ≥ 5 bars to avoid clutter, and positioned using ATR(14) x 0.2 for visibility.
-
Visual elements & interpretation
-
Three lines
-
Top (blue): upper zone boundary.
-
Middle (dotted): blended trend mean (EMA/HMA-style).
-
Bottom (blue): lower zone boundary.
-
-
Candle coloring
-
Green candles = active bull regime after a confirmed upside escape.
-
Red candles = active bear regime after a confirmed downside escape.
-
-
Retest diamonds (⯁)
-
Plot a green ⯁ below price in bull regimes (reclaiming trend-start).
-
Plot a red ⯁ above price in bear regimes (rejecting trend-start).
-
Inputs & settings
-
Length (
per)-
Default: 100
-
Range enforced: 60–200 (automatically clamped).
-
Effect: Governs the smoothness of the core averages. Larger = smoother bands; smaller = more responsive.
-
-
Candle coloring (
colorCandles)-
1 = on (default), 0 = off. When on, the indicator draws candles with regime colors.
-
-
ATR(14) for marker offset
-
Used only to place ⯁ slightly away from bars (±0.2 × ATR) for readability.
-
Note: Internally,
lengthfeeds both the EMA-like and HMA-style calculations, with the HMA-style period set tomax(20, length − 40)to maintain responsiveness.
Signals & trade ideas (not financial advice)
-
Breakout → Trend initiation
When price escapes the Top/Bottom and candles flip color, consider the new regime as in force. -
Retest continuation (⯁)
The diamond marks when price re-tests the trend-start level and reaffirms the regime. Many traders look for follow-through candles after the ⯁. -
Middle-line pullbacks
In an established trend, pullbacks toward the Middle can act as dynamic mean reversion spots for continuation, especially when the regime color remains intact.
ProBuilder code
|
1 2 3 4 5 6 7 8 9 10 11 12 13 14 15 16 17 18 19 20 21 22 23 24 25 26 27 28 29 30 31 32 33 34 35 36 37 38 39 40 41 42 43 44 45 46 47 48 49 50 51 52 53 54 55 56 57 58 59 60 61 62 63 64 65 66 67 68 69 70 71 72 73 74 75 76 77 78 79 80 81 82 83 84 85 86 87 |
// ------------------------------------------------------ //PRC_Zone Shift [ChartPrime] //version = 1 //06.11.2025 //Iván González @ www.prorealcode.com //Sharing ProRealTime knowledge // ------------------------------------------------------ // inputs // ------------------------------------------------------ per = 100 // Length 60-200 / minval = 60, maxval = 200 if per >200 then length=200 elsif per <60 then length=60 else length=per endif colorCandles=1 showsignals=1 showcloud=1 showlevel=1 UPcolorR=100 UPcolorG=200 UPcolorB=200 DNcolorR=200 DNcolorG=200 DNcolorB=100 atr=averagetruerange[14](close) // ------------------------------------------------------ // Indicator calculations // ------------------------------------------------------ once trend = 0 once trendStart = 0 once lastRetest = 0 ema= average[length,1](close) hma= average[max(20,length-40),8](close) dist=average[200](high-low) mid = (ema+hma)/2 itop = mid+dist ibot = mid-dist if low > itop and low[1] < itop[1] and not trend then drawsegment(trendStartidx,trendStart,barindex,trendStart)style(dottedline)coloured("grey",255*showlevel) trend=1 trendStart=low trendStartidx=barindex r=UPcolorR g=UPcolorG b=UPcolorB endif if high < ibot and high[1] > ibot[1] and trend then drawsegment(trendStartidx,trendStart,barindex,trendStart)style(dottedline)coloured("grey",255*showlevel) trend=0 trendStart=high trendStartidx=barindex r=DNcolorR g=DNcolorG b=DNcolorB endif // Retest TrendStart Level if (close > trendStart and close[1] < trendStart or low > trendStart and low[1] <trendStart) and trend and barindex-lastRetest>5 then lastRetest=barindex drawtext("⯁",barindex,low-0.2*atr)coloured(r,g,b,255*showsignals) endif if (close[1]>trendStart and close<trendStart or high[1]>trendStart and high<trendStart) and not trend and barindex-lastRetest>5 then lastRetest=barindex drawtext("⯁",barindex,high+0.2*atr)coloured(r,g,b,255*showsignals) endif if islastbarupdate then drawsegment(trendStartidx,trendStart,barindex,trendStart)style(dottedline)coloured("grey",255*showlevel) endif // ------------------------------------------------------ // PLOT // ------------------------------------------------------ if showtrend then drawrectangle(barindex,5,barindex+1,15)anchor(bottom,index,yshift)coloured(r,g,b,0)fillcolor(r,g,b) endif colorbetween(itop,ibot,r,g,b,95*showcloud) // ------------------------------------------------------ return mid as "Middle"style(dottedline), itop as "Top", ibot as "Bottom" |
Share this
No information on this site is investment advice or a solicitation to buy or sell any financial instrument. Past performance is not indicative of future results. Trading may expose you to risk of loss greater than your deposits and is only suitable for experienced investors who have sufficient financial means to bear such risk.
ProRealTime ITF files and other attachments :
Find other exclusive trading pro-tools on ![]()
PRC is also on YouTube, subscribe to our channel for exclusive content and tutorials


Non si carica
getting showtrend error undefined variable
Anche a me non si carica e poi manca definizione di variabile SHOWTREND
Sorry.
You should add new line after line 21.
showtrend=1
// ——————————————————
//PRC_Zone Shift [ChartPrime]
//version = 1
//06.11.2025
//Iván González @ http://www.prorealcode.com
//Sharing ProRealTime knowledge
// ——————————————————
// inputs
// ——————————————————
per = 100 // Length 60-200 / minval = 60, maxval = 200
if per >200 then
length=200
elsif per <60 then
length=60
else
length=per
endif
colorCandles=1
showsignals=1
showcloud=1
showlevel=1
showtrend=1
UPcolorR=100
UPcolorG=200
UPcolorB=200
DNcolorR=200
DNcolorG=200
DNcolorB=100
atr=averagetruerange[14](close)
// ——————————————————
// Indicator calculations
// ——————————————————
once trend = 0
once trendStart = 0
once lastRetest = 0
ema= average[length,1](close)
hma= average[max(20,length-40),8](close)
dist=average[200](high-low)
mid = (ema+hma)/2
itop = mid+dist
ibot = mid-dist
if low > itop and low[1] < itop[1] and not trend then
drawsegment(trendStartidx,trendStart,barindex,trendStart)style(dottedline)coloured(“grey”,255*showlevel)
trend=1
trendStart=low
trendStartidx=barindex
r=UPcolorR
g=UPcolorG
b=UPcolorB
endif
if high < ibot and high[1] > ibot[1] and trend then
drawsegment(trendStartidx,trendStart,barindex,trendStart)style(dottedline)coloured(“grey”,255*showlevel)
trend=0
trendStart=high
trendStartidx=barindex
r=DNcolorR
g=DNcolorG
b=DNcolorB
endif
// Retest TrendStart Level
if (close > trendStart and close[1] < trendStart or low > trendStart and low[1] <trendStart) and trend and barindex-lastRetest>5 then
lastRetest=barindex
drawtext(“⯁”,barindex,low-0.2*atr)coloured(r,g,b,255*showsignals)
endif
if (close[1]>trendStart and close<trendStart or high[1]>trendStart and high<trendStart) and not trend and barindex-lastRetest>5 then
lastRetest=barindex
drawtext(“⯁”,barindex,high+0.2*atr)coloured(r,g,b,255*showsignals)
endif
if islastbarupdate then
drawsegment(trendStartidx,trendStart,barindex,trendStart)style(dottedline)coloured(“grey”,255*showlevel)
endif
// ——————————————————
// PLOT
// ——————————————————
if showtrend then
drawrectangle(barindex,5,barindex+1,15)anchor(bottom,index,yshift)coloured(r,g,b,0)fillcolor(r,g,b)
endif
colorbetween(itop,ibot,r,g,b,95*showcloud)
// ——————————————————
return mid as “Middle”style(dottedline), itop as “Top”, ibot as “Bottom”
When i download it says the file is corrupt and when i try to paste the code something gets wrong. Can you please upload a new .itf file?
if you open the file with V13 you will have no problems.
You can copy/paste the original code and add new line below nr21 and write showtrend=1
Aha! Then I just need to figure out how to get v13. Is it released for IG customers?