







Zone Shift — Trend Zones and Retests
What is Zone Shift?
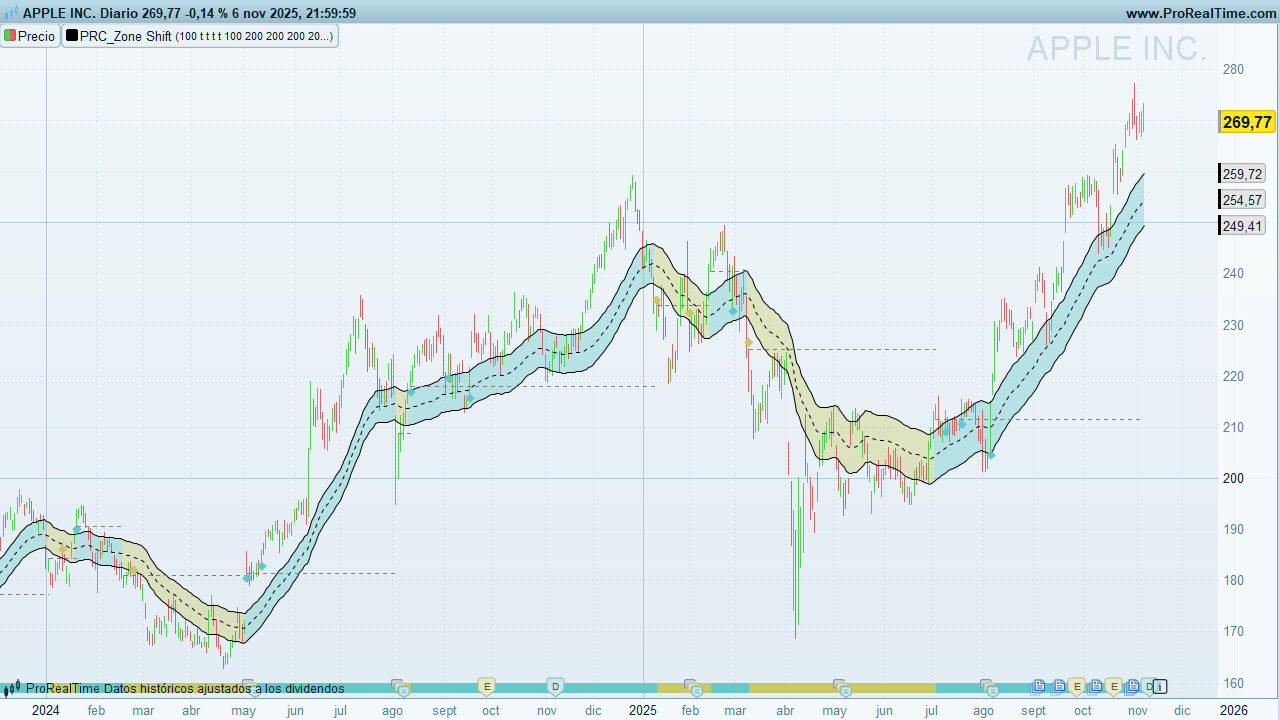
Zone Shift is a trend-and-channel indicator designed for clear, actionable context. It highlights when price escapes a dynamic envelope and then retests the breakout level. The tool works across timeframes:
-
Swing & positional: clean visual structure and reliable “zone memory.”
-
Intraday: responsive enough for trend days; still mindful of retests.
Use it to:
-
Confirm trend bias (green/red candles).
-
Track dynamic zones (top/bottom bands).
-
Spot retests of the trend-start level (diamond signals) that often precede continuation.
How it works
-
Core averages
-
ema: an exponential-style average ofcloseusinglength(user-driven). -
hma: a faster, HMA-like average usingmax(20, length − 40)for the period. -
Middle line (
mid) = average ofemaandhma.
-
-
Dynamic distance
-
dist= simple average of the true bar range(high − low)over 200 bars. -
Top (
itop) =mid + dist; Bottom (ibot) =mid − dist.
-
-
Trend flip logic
-
Bull flip: when the low closes above
itopwhile the prior bar’s low was below the prioritop.
→trend = 1,trendStart = low, candles turn green. -
Bear flip: when the high falls below
ibotwhile the prior bar’s high was above the prioribot.
→trend = 0,trendStart = high, candles turn red.
-
-
Retest logic (⯁)
-
After a flip, the indicator tracks the trend-start level (
trendStart). -
Bull trend: prints a green ⯁ when price crosses back above
trendStart. -
Bear trend: prints a red ⯁ when price crosses back below
trendStart. -
Markers are spaced by ≥ 5 bars to avoid clutter, and positioned using ATR(14) x 0.2 for visibility.
-
Visual elements & interpretation
-
Three lines
-
Top (blue): upper zone boundary.
-
Middle (dotted): blended trend mean (EMA/HMA-style).
-
Bottom (blue): lower zone boundary.
-
-
Candle coloring
-
Green candles = active bull regime after a confirmed upside escape.
-
Red candles = active bear regime after a confirmed downside escape.
-
-
Retest diamonds (⯁)
-
Plot a green ⯁ below price in bull regimes (reclaiming trend-start).
-
Plot a red ⯁ above price in bear regimes (rejecting trend-start).
-
Inputs & settings
-
Length (
per)-
Default: 100
-
Range enforced: 60–200 (automatically clamped).
-
Effect: Governs the smoothness of the core averages. Larger = smoother bands; smaller = more responsive.
-
-
Candle coloring (
colorCandles)-
1 = on (default), 0 = off. When on, the indicator draws candles with regime colors.
-
-
ATR(14) for marker offset
-
Used only to place ⯁ slightly away from bars (±0.2 × ATR) for readability.
-
Note: Internally,
lengthfeeds both the EMA-like and HMA-style calculations, with the HMA-style period set tomax(20, length − 40)to maintain responsiveness.
Signals & trade ideas (not financial advice)
-
Breakout → Trend initiation
When price escapes the Top/Bottom and candles flip color, consider the new regime as in force. -
Retest continuation (⯁)
The diamond marks when price re-tests the trend-start level and reaffirms the regime. Many traders look for follow-through candles after the ⯁. -
Middle-line pullbacks
In an established trend, pullbacks toward the Middle can act as dynamic mean reversion spots for continuation, especially when the regime color remains intact.
ProBuilder code
// ------------------------------------------------------
//PRC_Zone Shift [ChartPrime]
//version = 1
//06.11.2025
//Iván González @ www.prorealcode.com
//Sharing ProRealTime knowledge
// ------------------------------------------------------
// inputs
// ------------------------------------------------------
per = 100 // Length 60-200 / minval = 60, maxval = 200
if per >200 then
   length=200
elsif per <60 then
   length=60
else
   length=per
endif
colorCandles=1
showsignals=1
showcloud=1
showlevel=1
UPcolorR=100
UPcolorG=200
UPcolorB=200
DNcolorR=200
DNcolorG=200
DNcolorB=100
atr=averagetruerange[14](close)
// ------------------------------------------------------
// Indicator calculations
// ------------------------------------------------------
once trend = 0
once trendStart = 0
once lastRetest = 0

ema= average[length,1](close)
hma= average[max(20,length-40),8](close)
dist=average[200](high-low)
mid = (ema+hma)/2
itop = mid+dist
ibot = mid-dist

if low > itop and low[1] < itop[1] and not trend then
   drawsegment(trendStartidx,trendStart,barindex,trendStart)style(dottedline)coloured("grey",255*showlevel)
   trend=1
   trendStart=low
   trendStartidx=barindex
   r=UPcolorR
   g=UPcolorG
   b=UPcolorB
endif

if high < ibot and high[1] > ibot[1] and trend then
   drawsegment(trendStartidx,trendStart,barindex,trendStart)style(dottedline)coloured("grey",255*showlevel)
   trend=0
   trendStart=high
   trendStartidx=barindex
   r=DNcolorR
   g=DNcolorG
   b=DNcolorB
endif

// Retest TrendStart Level

if (close > trendStart and close[1] < trendStart or low > trendStart and low[1] <trendStart) and trend and barindex-lastRetest>5 then
   lastRetest=barindex
   drawtext("⯁",barindex,low-0.2*atr)coloured(r,g,b,255*showsignals)
endif

if (close[1]>trendStart and close<trendStart or high[1]>trendStart and high<trendStart) and not trend and barindex-lastRetest>5 then

   lastRetest=barindex
   drawtext("⯁",barindex,high+0.2*atr)coloured(r,g,b,255*showsignals)
endif

if islastbarupdate then
   drawsegment(trendStartidx,trendStart,barindex,trendStart)style(dottedline)coloured("grey",255*showlevel)
endif
// ------------------------------------------------------
// PLOT
// ------------------------------------------------------
if showtrend then
   drawrectangle(barindex,5,barindex+1,15)anchor(bottom,index,yshift)coloured(r,g,b,0)fillcolor(r,g,b)
endif
colorbetween(itop,ibot,r,g,b,95*showcloud)
// ------------------------------------------------------
return mid as "Middle"style(dottedline), itop as "Top", ibot as "Bottom"
Comments
You must be logged in to post a comment.

Sorry. You should add new line after line 21. showtrend=1 // ------------------------------------------------------ //PRC_Zone Shift [ChartPrime] //version = 1 //06.11.2025 //Iván González @ www.prorealcode.com //Sharing ProRealTime knowledge // ------------------------------------------------------ // inputs // ------------------------------------------------------ per = 100 // Length 60-200 / minval = 60, maxval = 200 if per >200 then length=200 elsif per <60 then length=60 else length=per endif colorCandles=1 showsignals=1 showcloud=1 showlevel=1 showtrend=1 UPcolorR=100 UPcolorG=200 UPcolorB=200 DNcolorR=200 DNcolorG=200 DNcolorB=100 atr=averagetruerange[14](close) // ------------------------------------------------------ // Indicator calculations // ------------------------------------------------------ once trend = 0 once trendStart = 0 once lastRetest = 0 ema= average[length,1](close) hma= average[max(20,length-40),8](close) dist=average[200](high-low) mid = (ema+hma)/2 itop = mid+dist ibot = mid-dist if low > itop and low[1] < itop[1] and not trend then drawsegment(trendStartidx,trendStart,barindex,trendStart)style(dottedline)coloured("grey",255*showlevel) trend=1 trendStart=low trendStartidx=barindex r=UPcolorR g=UPcolorG b=UPcolorB endif if high < ibot and high[1] > ibot[1] and trend then drawsegment(trendStartidx,trendStart,barindex,trendStart)style(dottedline)coloured("grey",255*showlevel) trend=0 trendStart=high trendStartidx=barindex r=DNcolorR g=DNcolorG b=DNcolorB endif // Retest TrendStart Level if (close > trendStart and close[1] < trendStart or low > trendStart and low[1] <trendStart) and trend and barindex-lastRetest>5 then lastRetest=barindex drawtext("⯁",barindex,low-0.2*atr)coloured(r,g,b,255*showsignals) endif if (close[1]>trendStart and close<trendStart or high[1]>trendStart and high<trendStart) and not trend and barindex-lastRetest>5 then lastRetest=barindex drawtext("⯁",barindex,high+0.2*atr)coloured(r,g,b,255*showsignals) endif if islastbarupdate then drawsegment(trendStartidx,trendStart,barindex,trendStart)style(dottedline)coloured("grey",255*showlevel) endif // ------------------------------------------------------ // PLOT // ------------------------------------------------------ if showtrend then drawrectangle(barindex,5,barindex+1,15)anchor(bottom,index,yshift)coloured(r,g,b,0)fillcolor(r,g,b) endif colorbetween(itop,ibot,r,g,b,95*showcloud) // ------------------------------------------------------ return mid as "Middle"style(dottedline), itop as "Top", ibot as "Bottom"



Non si carica
When i download it says the file is corrupt and when i try to paste the code something gets wrong. Can you please upload a new .itf file?