VWAP intraday

v10.3
VWAP intraday

Volume Weighted Average Price is equal to the sum of the volume of every transaction multiplied by the price of every transaction divided by the total volume for the trading day.

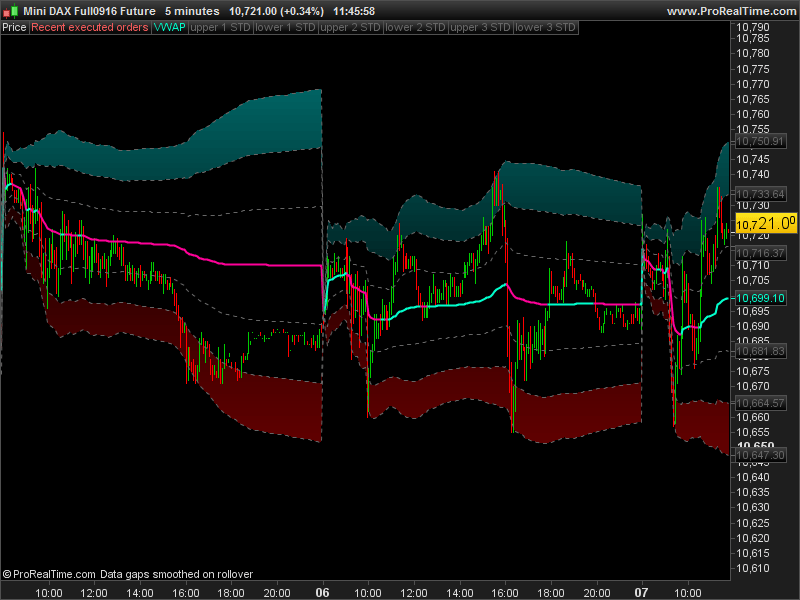
This version is for intraday trading, the VWAP is resetting each day at the first intraday bar. I added the 3 standard deviation of the VWAP as upper and lower bands to expect reversal patterns. VWAP will be displayed only on instruments with volumes. This version is only compatible with Prorealtime 10.3.

The prorealtime v10.2 version of this VWAP indicator is now also available for download below this article, for everyone convenience 🙂

Share this

Risk disclosure:

No information on this site is investment advice or a solicitation to buy or sell any financial instrument. Past performance is not indicative of future results. Trading may expose you to risk of loss greater than your deposits and is only suitable for experienced investors who have sufficient financial means to bear such risk.

ProRealTime ITF files and other attachments : How to import ITF files into ProRealTime platform?

PRC is also on YouTube, subscribe to our channel for exclusive content and tutorials

  1. ALEALE • 09/07/2016 #

    Dear Nicolas,
    could you update indicator for version 10,2?
    thanks
    ALEALE

    • Nicolas • 09/07/2016 #

      Just remove everything related to “STYLE” in the code and you’re ok for 10.2.

  2. Bon Zo • 09/07/2016 #

    You are the boss 😉

  3. Florian Legeard • 09/07/2016 #

    Bonjour Nicolas,
    Merci pour ce travail. Le code me dit erreur de syntaxe ligne 28 , caractère 31 mais je ne vois pas d’où vient le problème ?
    Merci pour votre retour

    • Nicolas • 09/07/2016 #

      L’indicateur étant codé pour la version 10.3 de PRT, certaines instructions générent donc des erreurs de syntaxe dans les version précédentes. Pour rendre compatible l’indicateur, il suffit de supprimer toutes les instructions ‘STYLE’ dans la ligne 28.

  4. sincitytrader • 09/07/2016 #

    Hi Nicholas,  I tried removing the style elements, but came up with an issue.
    Thanks
     
    //PRC_VWAP intraday
    //07.09.2016
    //Nicolas @ www.prorealcode.com
    //Sharing ProRealTime knowledge

    d = max(1, intradaybarindex)

    VWAP = SUMMATION[d](volume*typicalprice)/SUMMATION[d](volume)
    if(intradaybarindex=0) then
    sd = 0
    else
    sd = SUMMATION[d](max(abs(high-vwap),abs(vwap-low)))/d
    endif

    SDup1 = vwap+sd
    SDlw1 = vwap-sd
    SDup2 = vwap+sd*2
    SDlw2 = vwap-sd*2
    SDup3 = vwap+sd*3
    SDlw3 = vwap-sd*3

    if vwap>vwap[1] then
    color = 1
    else
    color = -1
    endif

    RETURN VWAP

  5. sincitytrader • 09/07/2016 #

    Managed to fix it now.  Here’s the code for the last RETURN line.  I then added the colours and colour zones back in using the Prorealtime indicator. All good!
     
    RETURN VWAP as “VWAP”, SDup1 as “upper 1 STD”, SDlw1 as “lower 1 STD”, SDup2 as “upper 2 STD”, SDlw2 as “lower 2 STD”, SDup3 as “upper 3 STD”, SDlw3 as “lower 3 STD”

  6. Wilko • 09/07/2016 #

    Nice indicator for shorter time frame charts! Please correct me if I am wrong, but I assume this indicator will be exact only on a tic-by-tic chart? I.e. the assumption is that the volume inside the bar is done on average at TypicalPrice, which may be close to reality or not. The larger the bar-range, the larger the scope for error. If I am correct one should avoid using this indicator on larger time-frame charts, as the result could lead to wrong conclusions. 

    • Nicolas • 09/07/2016 #

      Summation of information collected on each bar lead to the same results on any timeframe. No matter how many 100 ticks candlesticks were made on a 1 minute bar for example, since compounded Volume is the same at the end. I’m using it almost every day since IG give Volumes on CFDs account, on 1 minute timeframe and I ensure you that price react perfectly and precisely on Vwap! Would be glad to discuss about it if you like 🙂 

  7. Wilko • 09/07/2016 #

    Thanks for quick response! I am well aware of the importance of VWAP and also VPOC (I have not yet seen an indicator for this) for short term price movements in the market, hence my interest in the subject. I agree that the volume compounded is the same irrespective of timeframe, but I am not sure about price. If you take for example a 5m bar with High 105, Low 95 and Close 100 will result in TypicalPrice of 100. The way I understand the VWAPindicator, it will calculate VWAP for this bar alone to 100. But lets suppose you compare these 5 minutes to lower timeframe, for example the five 1min bars that constitute the single 5min bar with TypicalPrice 100. Let’s assume TypicalPrice for the first 1min bar is 96 and (in this extreme example) 100% of the volume in the 5m bar was transacted the first 1min (ie 0 volume in the remaining four 1min bars). The vwap for the five 1min bars together will be 96, but vwap for the 5min bar would still be 100. In other words, the larger you go on timeframes, the more likely it is that TypicalPrice is not equal to actual traded price. As long as you are on 1m timeframes, you will likely be reasonably accurate in your assumption that TypicalPrice cooresponds to actual traded price. As soon as you go to longer timeframes it will by definition become less accurate.
    Or is there something I am missing or have misunderstood?

    • Nicolas • 09/07/2016 #

      Please find examples on a CFD account on DAX: http://prntscr.com/d6t950
      As you can see through this 4 different timeframes (from 1 minute to 4 hours), the calculated values of VWAP are the same (I spot a 2 points difference on H4 though..) on any of them. No matter how much TypicalPrice are calculated, since the compound of all of them is divided by the whole candlesticks the chart has since the daily open.

  8. Alco Aarts • 09/07/2016 #

    Could someone please share the code for v10.2
    Nicolas, I don’t know what you mean with just remove everything related with ”style”
    Thanks

    • Nicolas • 09/07/2016 #

      Sincitytrader make it already: http://www.prorealcode.com/prorealtime-indicators/vwap-intraday/#comment-2069 and http://www.prorealcode.com/prorealtime-indicators/vwap-intraday/#comment-2071

    • Wilko • 09/07/2016 #

      Having tested this indicator, I have found that the VWAP-level t is indeed dependent on the bar resolution used. E.g the VWAP this last Friday (25/11) was 10.682 using 1min resolution. But going up to 2h resolution it was 10.685 and scaling up to 4h resolution made it 10.707. This is due to the fact that the indicator merely uses typical price and not actual traded price (there is no look inside bar functionality in PRT), which can throw off the calculation considerably if  using the indicator on larger timeframes. I just wanted to point it out so that everyone is aware. 

    • Nicolas • 09/07/2016 #

      Yes I noticed that too. Thanks for pointing it. There is also a Vwap indicator embedded in the platform, do you also notice that difference with it? This code is my own original version of the Vwap and it give me very precise and so precious information about bull/bear territories in intraday timeframes,if you have ideas to improve it with your own experience and observations, please let me know 😉 I’d be happy to add them.

  9. Alco Aarts • 09/07/2016 #

    Thanks Nicolas!

    • IG_CFD_Trader • 09/07/2016 #

      Hi Nicolas,
      Do you or does anyone have the original code the VWAP indicator that is embedded in the PRT platform?
      Your indicator is precise in terms of calculating the VWAP value but at intradaybarindex=0, it goes funny because d=max(1,intradaybarindex). The PRT indicator can be set to day or intraday and stays consistent all the way back to beginning of chart.
      Now the issue with PRT indicator is that it cannot be called up in programming so need the exact actual code for PRT VWAP indicator if possible

    • Nicolas • 09/07/2016 #

      You will find the VWAP code from PRT here: https://www.prorealcode.com/topic/is-there-any-working-intraday-vwap/#post-116309

  10. Alco Aarts • 09/07/2016 #

    When I want to add the indicator, I get an error. ”Syntax error: This variable is not used in the code:color

  11. ncarlsson87 • 09/07/2016 #

    Hi Nicolas! I got the same problem as Alco Aarts, please help us untechnical guys=) 

  12. Nicolas • 09/07/2016 #

    The PRT 10.2 version of the VWAP indicator is now also available for download for everyone.

  13. ncarlsson87 • 09/07/2016 #

    Thank you a lot Nicolas! 

  14. DegoodBoby • 09/07/2016 #

    thanks a million times Nicolas!

  15. klal • 09/07/2016 #

    Hi Nicolas,
    I’ve been using your 10.2 version of this indicator and find it highly useful.  In that version, you’ve included the ability to plot the previous day’s closing VWAP.  I’ve tried to think of a way by which we can pick up the closing VWAP for say, 2 or 3 days ago but can’t work out a solution.  Wish there was a constant for volume similar to DClose.  Can you suggest a work around?  Grateful for any help/pointers.
     

  16. scarface34 • 09/07/2016 #

    Hi Nicolas,
    I have noticed that the VWAP in Pro real time does not include the first minute volume data in its calculations – hence there is a variance in the data if you compare with other charting software.
    Is it possible to create another VWAP indicator using the TOS code please.

    • Nicolas • 09/07/2016 #

      Please add a specific query in ProBuilder forum with the indicator’s code attached as a text file instead. Thank you.

  17. enuxx • 09/07/2016 #

    I have not the green and red color zone with this indicator. How can I made similar the chart above?

    • Nicolas • 09/07/2016 #

      add them manually in the indicator’s window settings.

  18. alainp • 09/07/2016 #

    @Nicolas, pour l’indicateur VWAP BANDS disponible par défaut sur la plateforme PRT, les niveaux sont identiques quelque soit le timeframe sauf sur les graphiques en ticks.
    Est il possible d’y remedier?

    • Nicolas • 09/07/2016 #

      Cela est sans doute dut au fait qu’il n’y pas suffisament d’historique pour correctement calculer le VWAP. Assurez vous d’avoir un maximum d’unités affichées pour obtenir l’intégralité de la journée, cela réglera sans doute ce problème.

  19. Theopolis • 09/07/2016 #

    Hi Nicolas, no matter which VWAP indicator I try and load it doesn’t seem to do anything? Does not appear on the chart at all?

    • Theopolis • 09/07/2016 #

      Sorry ignore me, I was looking at forex which didnt have any volume. I gather you cant use on forex. I cant seem to get the colour coding in the sample going though. Cheers

  20. carlo__ • 09/07/2016 #

    Hi Nicolas, this is the latest version of the script or you released an updated version?

    • Nicolas • 09/07/2016 #

      There are some other different versions around, in forums.

  21. jbeagle2 • 09/07/2016 #

    This code no longers seems to work in V11. Anybody figure out why yet?

  22. axellus • 09/07/2016 #

    Is this working for anyone?

  23. Dadoo • 09/07/2016 #

    Bonjour et Merci Nicolas.
    Si je comprends bien, votre indicateur est le vrai VWAP Bands, construit sur les déviations standard alors que celui par défaut dans PRT basé sur les écarts type. C’est bien cela?

    • Nicolas • 09/07/2016 #

      Standard Deviation = Ecart type en français, c’est la même chose 🙂

    • Dadoo • 09/07/2016 #

      Merci Nicolas je me coucherai moins bête 🙂 Dans ce cas, quelle différence avec l’indicateur fourni avec PRT ?

    • Nicolas • 09/07/2016 #

      Aucune, mais puisqu’il n’y a pas d’instruction pour l’utiliser dans un programme, il faut donc en avoir le code, la formule.

  24. Armyx101 • 09/07/2016 #

    Thanks Nicolas,
    Much needed if you use the 10.2 version as me. Great job.

  25. Miko31 • 09/07/2016 #

    Bonjour Nicolas, est-ce qu’il existe un screener en 2mn pour cette version du VWAP ?
    conditions = close casse le VWAP à la hausse
    Merci

    • Nicolas • 09/07/2016 #

      sauf erreur de ma part, il n’y a pas d’UT 2 minutes dans ProScreener.

  26. Miko31 • 09/07/2016 #

    Ha ?
    il me semble que j’ai l’option 2mn sur les screeners, et ça marche, sauf erreur de ma part. Cf ci-joint.

    • Nicolas • 09/07/2016 #

      Oui en effet, dans ce cas il faut tester: close crosses over VWAP
      sinon on peut utiliser la création assistée, c’est pratique pour ce genre de screener très simple.

  27. Miko31 • 09/07/2016 #

    En effet,
    cependant, je souhaite faire tourner le screener VWAP en 2 ou 5 ou 10 mn et aussi avoir des conditions en DAILY dans ce screener pour exclure les les Penny Stock (close<1$) et pour m'assurer qu'on est en haussier (PRTbands trend =1).

    Pourriez-vous m'aider car je n'ai pas trouvé l'instruction VWAP dans le manuel de code et donc j'utilise le code "//PRC_VWAP intraday //07.09.2016" ci-dessus, mais ça ne marche pas. …

    Merci par avance.

    • Nicolas • 09/07/2016 #

      Merci de formuler une demande dans le forum ProScreener pour ce code spécifique, tout en respectant les règles de publication 🙂

  28. keks • 09/07/2016 #

    Thanks for sharing this wonderful code. Is there a way to draw a horizontal line to plot previous end of day VWAP level? For trend purposes it would be interesting for me to have an intraday horizontal line showing where vwap was previous end of day…

  29. taklause • 131 days ago #

    Hello, just one question, can it be that this indicator does not work on ProRealTime v12?

    The following implementation works, for other people who might struggle 😉 – https://www.prorealcode.com/topic/vwap-band-indicator/

avatar
Register or

Likes

avatar avatar avatar avatar avatar avatar avatar avatar avatar avatar avatar avatar avatar
Related users ' posts
yeoreum Thank you very much for the screener, it reminds me on Minervini VCP. How to change th...
reecet any codes like this but in minutes and hours rather than days?
PHAN100 bonjour, je viens de tester ce screener, je constate une anomalie...il ne renvoie pas l'e...
jaginho Bonjour Vivien, je n'arrive pas à comprendre ce screener... En tout cas merci pour tes contr...
avatar
Anonymous Superb, merci!
kal Buenos días TACBOLSA. Estoy muy interesado en ver tu blog para ver la explicación con detall...
1Randy I would be interested an invite to your blog. I am still learning about the VSA and it looks...
repropel Buenos días TACBOLSA. Yo también estoy interesado en visitar tu blog. Podrías enviarme una i...
Maxime Baudin Very useful! Thanks Mat, and Happy New Year
nicko Great work. Thank you. However I am having trouble getting it to print in the first bar. If ...
Marie-Eve Vergoz Bonsoir - Voici l'erreur qui est signalée lorsque je souhaite utiliser cet indicateur : il...
Meta Signals Pro Pleasure ! Please let us know if you make good trades with it and if you see improvements we...
francis59 Bonjour, Bonjour, comment puis-je créer un screener basé sur cet indicateur, qui affiche le...
Trader Sab I am curious to try it how, however I get an error message for line 47 and 48 - drawsegment,...
Om Hello, thanks for sharing! Getting a message that Variable P is undefined?
matin Intraday Average Volume Indicator Not working, what can i do plz
LucioleLucide Clean view, thanks for sharing
dertopen hi where i can found the window for candle configuration?
paolosab69 Ciao! . I have seen the pictures that explain this metod but i don't understand when is mome...
Ciccio
5 years ago
Vinks_o_7 Apirine also offers a very interesting update of the OBV...
TACBOLSA
5 years ago
dario ti please can you help me to understand? i know i am wrong: Long Histogram = High Volume S...
TAC Bolsa hi, I have already seen the problem and requested that it be removed until an adequate so...
sixeight Hey TAC, Did you ever find a solution to this?
Vinks_o_7 b=close > low and volume > high How can we compare volume and high of the day? (orang...
TAC Bolsa If to understand something you resort to compare Oranges and bananas. You go bad, Without e...
giumagi good morning Sir, great job your indicators! How can I reach your website or blog? please..t...
Gianluca THANK YOU!!!!!
JOSEBA que relaccion tiene la numeración de las barras del 1 al 10 que tiene cada número Tengo dos...
marcov66 Hi, it seems a very useful indicator. Unfortunately the link here for the full explanation d...
TACBOLSA Discontinued indicator. we are sorry.
Azzuerus Bonjour, je teste et j'utilise vos indicateurs depuis plusieurs années, et ils me sont dev...
bremze33 Another thing. Is it possible to make the graph lines a little thicker and not so long? Be...
giumagi Hi Sir, very good job done with this indicator, May I ask you to explain what is the line VW...
pmdr1969 Hola soy nuevo en en esto. ¿Hay algo parecido pero pudiendo tu elegir las velas a a analizar...
Nicolas Add indicator on price doesnt require any specific type of subcription. Click on the wrench ...
tahiti bonjour j'ai une petite question comment peux on enlevé la bar blanche sur la bougie en cour...
sixeight Hi Kris, is there a way to increase the number of rows? I get a loop error
Nicolas Good job Gabri, I confirm that with the new ProRealTime v11, everyone will be able to use in...
Slowlyslowly can u just help me with the exact definition of percbox , mm and period to understand will a...

Top