

ANTS indicator
The ANTS Indicator is a custom technical tool designed for ProRealTime that uses daily timeframes to highlight specific conditions in price and volume movements over a 15-day period. It visually marks patterns on the chart using colored points to make the analysis more intuitive and actionable. Below, we’ll explore how this indicator works, its main components, and how to apply it.
Key Features of the ANTS Indicator
The ANTS Indicator uses three key conditions based on price and volume averages:
- C1: Price Momentum
Detects whether the closing price has increased compared to the previous day for at least 12 out of the last 15 days. - C2: Volume Surge
Compares the average volume over the last 15 days to the average volume from 16 to 50 days ago. A significant surge in recent volume (20% or more) is flagged. - C3: Price Increase Over Time
Checks if the average closing price of the last 15 days is at least 20% higher than the average closing price from 16 to 50 days ago.
How the Indicator Works
Conditions and Visualization
The ANTS Indicator uses the above conditions to categorize price behavior into four scenarios, each represented by a distinct color on the chart:
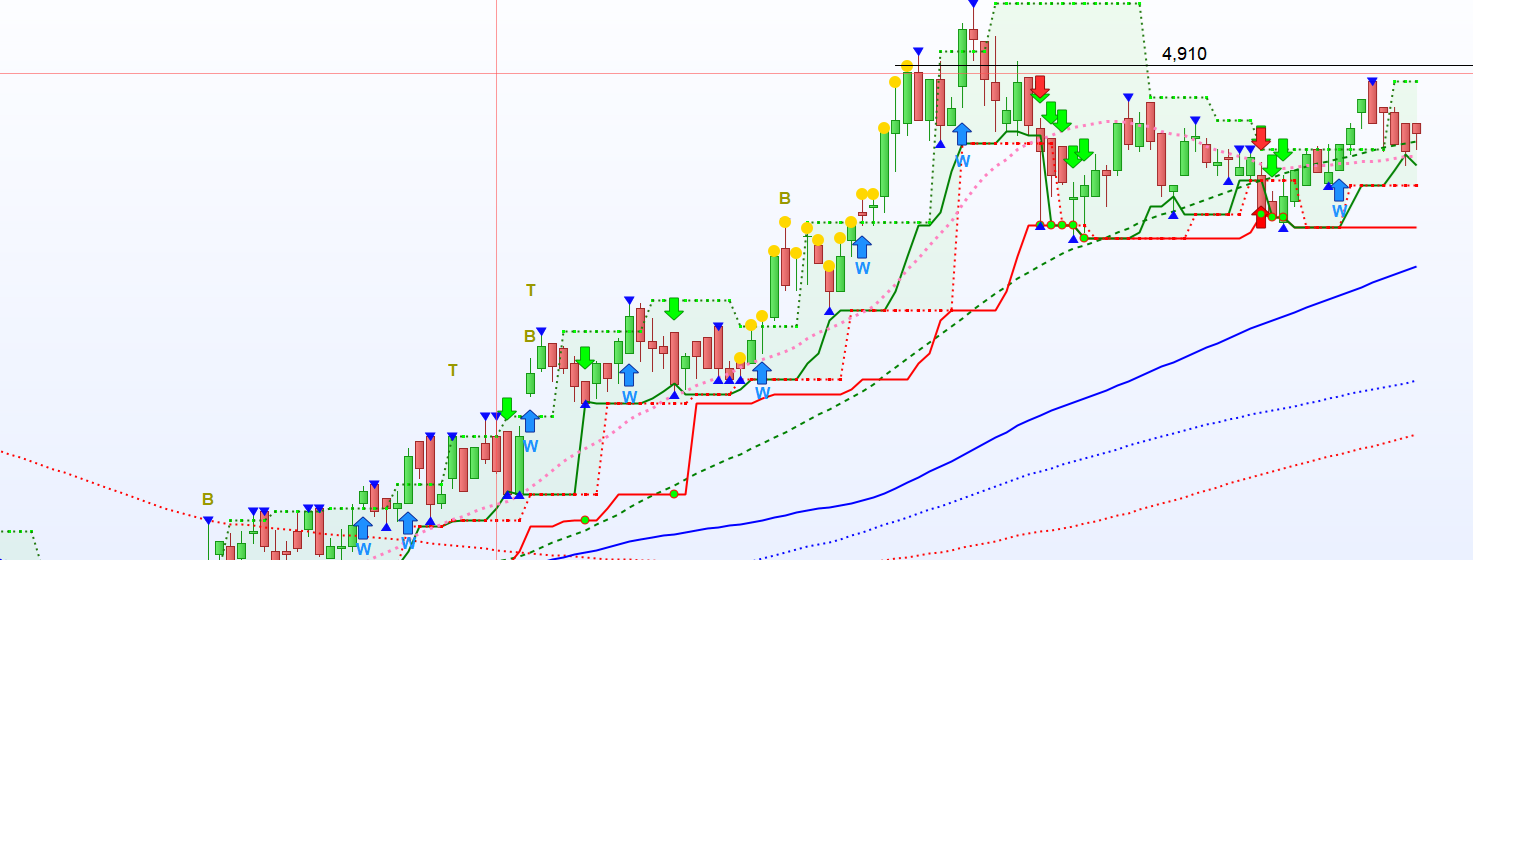
- Green Points
When C1, C2, and C3 are true, the indicator plots green points on the highs of the last 15 bars. This signifies strong momentum in price and volume, accompanied by a significant increase in average prices. - Blue Points
When C1 and C3 are true but C2 is false, the indicator plots blue points. This suggests price momentum and an increase in average prices, but without significant volume support. - Gold Points
When C1 and C2 are true but C3 is false, the indicator plots gold points. This indicates strong momentum in price and volume, but without a substantial increase in average price levels. - Silver Points
When only C1 is true, the indicator plots silver points. This reflects general price momentum without significant increases in volume or average price levels.
Code Explanation
Here’s how the code works for each condition:
C1 = Summation[15](close>close[1])>=12
C2 = Average[15](volume)> Average[50](volume[16])*1.2
C3 = Average[15](close)> Average[50](close[16])*1.2

If C1 and C2 and C3 then
for i=0 to 14
DRAWPOINT((barindex - i), high[i], 3) coloured("green")
next
Endif

If C1 and not C2 and C3 then
for i=0 to 14
DRAWPOINT((barindex - i), high[i], 3) coloured("blue")
next
Endif

If C1 and C2 and not C3 then
for i=0 to 14
DRAWPOINT((barindex - i), high[i], 3) coloured("gold")
next
Endif

If C1 and not C2 and not C3 then
for i=0 to 14
DRAWPOINT((barindex - i), high[i], 3) coloured("silver")
next
Endif

Return
How to Customize and Use
You can modify the thresholds for C2 and C3 to fit different trading styles or instruments. For example:
- Change the volume multiplier: Adjust
1.2to a higher or lower value to fine-tune the sensitivity of the volume condition. - Adjust the price growth requirement: Modify
1.2in C3 to reflect different levels of price increase expectations.
Practical Applications
The ANTS Indicator is particularly useful for identifying potential breakout scenarios, trend continuations, or market exhaustion based on the interplay of price and volume dynamics. Here’s how traders might use it:
- Trend Following: Green points signal strong upward trends supported by volume and price growth.
- Volume Divergence: Blue points highlight situations where price increases lack volume support, potentially indicating weakening trends.
- Momentum Shifts: Gold and silver points may indicate shifts in momentum or consolidation phases.
Conclusion
The ANTS Indicator combines momentum and volume analysis to provide traders with a visually intuitive tool for spotting actionable patterns in daily timeframes. By customizing its parameters, it can be tailored to suit various market conditions and trading strategies.
Try it on your ProRealTime charts today to see how it aligns with your trading style!