







Volume Stops
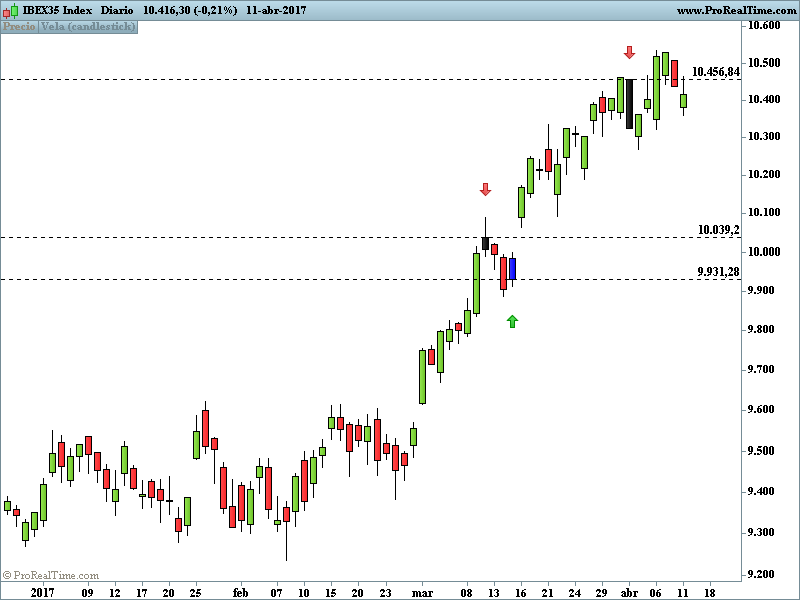
Adaptation for the indicator platform Prorealtime v10.3 created by Gqman for the Tradingview platform.
Volume Stops is based on the increase or decrease of volume in relation to the opening and closing of the last 3 bars or candles.
Blue candles are bullish signs.
Black candles are bearish signs.
The Stop Loss is placed in the opening of the candle and is not made effective until a closing takes place piercing that level.
The openings are used as supports / resistances.
REM VOLUME STOPS
//código original para la plataforma Tradingview por Gqman
//adaptación para la plataforma Prorealtime v10.3


redbar=open>=close
greenbar=open<=close
long1=volume[2]<volume[1] and volume[1]<volume[0] and redbar[2] and redbar[1] and greenbar[0]
short1=volume[2]<volume[1] and volume[1]<volume[0] and greenbar[2] and greenbar[1] and redbar[0]
long2=volume[2]>volume[1] and volume[1]>volume[0] and redbar[2] and redbar[1] and greenbar[0]
short2=volume[2]>volume[2] and volume[1]>volume[0] and greenbar[2] and greenbar[1] and redbar[0]

if long1 or long2 then
drawcandle (open,high,low,close) coloured (0,0,255) bordercolor (0,0,0)
elsif short1 or short2 then
drawcandle (open,high,low,close) coloured (0,0,0) bordercolor (0,0,0)
endif

return
Comments
You must be logged in to post a comment.



Hello, I believe there is an error in your code line 11. short2=volume[2]>volume[2] and volume[1]>volume[0] and greenbar[2] and greenbar[1] and redbar[0] Instead of 2 it should be 1 short2=volume[2]>volume[1] and volume[1]>volume[0] and greenbar[2] and greenbar[1] and redbar[0]

Hola, bolsatrilera, me parece muy bueno el indicador.Se podria hacer un escreener con este indicador buscando las velas azules, gracias.

Congratulations. Of all the indicators that I have been able to examine, in my opinion and for my operation, it seems to me to be the best. I saw it once for a very profitable trader who relied on institutional hand volume entry candles for these small corrections he makes in a trend. Very thankful