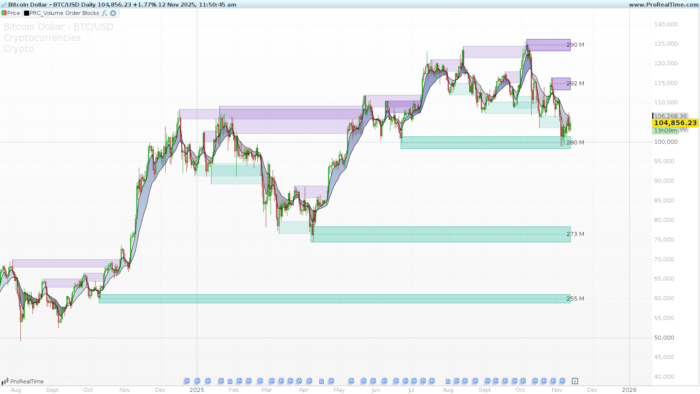
Today, we are thrilled to feature a powerful and sophisticated indicator developed by BigBeluga: the Volume Order Blocks (VOB).
This indicator is designed to automatically identify and plot high-probability “Order Blocks” directly on your ProRealtime charts. These blocks represent significant zones of supply and demand, which often act as strong dynamic support or resistance levels.
How the Indicator Works (The Logic)
At its core, the VOB indicator identifies potential trend reversals and the price zones that trigger them. It combines trend analysis with price extremes to define these blocks.
1. The Trend Trigger (EMA Cross)
The indicator first establishes the medium-term trend using two Exponential Moving Averages (EMAs), a fast one and a slow one. A crossover of these EMAs signals a potential shift in the market direction and serves as the trigger for the indicator to start looking for a new order block.
2. Identifying Bullish Blocks (Demand)
When the indicator detects a bullish EMA crossover (the fast EMA crosses above the slow EMA), it signals that a new uptrend may be forming.
The indicator then scans the bars before this crossover to find the absolute lowest low price. This extreme low point, and the body of the candle that created it, represents the “Demand Block.” This zone is plotted as a green rectangle and extended into the future. The logic is that this was the last significant level where selling pressure was exhausted and demand took control.
3. Identifying Bearish Blocks (Supply)
Conversely, when the indicator detects a bearish EMA crossover (the fast EMA crosses below the slow EMA), it signals a potential new downtrend.
It scans the bars before this cross to find the absolute highest high price. This extreme high point forms the “Supply Block.” This zone is plotted as a red rectangle, representing the last significant level where buying pressure was exhausted and supply took over.
4. When is a Block “Broken” or Invalidated?
This is the most critical feature. A block remains active (and extended) on the chart until it is “broken” or “mitigated” by price.
- A Bullish (Demand) Block is considered broken when price closes below its low.
- A Bearish (Supply) Block is considered broken when price closes above its high.
This feature allows you to see exactly which zones are still active and which have failed.
5. Visuals & Chart Cleaning
The indicator also includes two features to improve usability:
- EMA Shadow: It can draw a colored cloud (or “shadow”) between the fast and slow EMAs, giving you a clear visual representation of the current trend.
- Overlap Detection: To prevent chart clutter, the indicator uses the Average True Range (ATR) to detect if two new blocks of the same type (e.g., two bullish blocks) are too close together. If they are, it intelligently removes the older, less relevant block.
How to Use the Volume Order Blocks Indicator
As Dynamic Support & Resistance
The most common use for VOB is to identify high-probability support (Demand) and resistance (Supply) levels.
- When price pulls back to an active Demand Block (green), traders can watch for signs of rejection (bounces) as potential long entry signals.
- When price rallies into an active Supply Block (red), traders can watch for signs of rejection as potential short entry signals.
- The midline of the block (which can be toggled on) often acts as a significant level of interest (a 50% retracement) within the zone.
Identifying “Breaks of Structure” (BoS)
The invalidation of a block is just as important as the block itself.
- When price decisively closes below a Demand Block, it signals a “Break of Structure” (BoS) to the downside. This suggests the trend is turning bearish.
- When price decisively closes above a Supply Block, it signals a BoS to the upside, suggesting strong bullish momentum.
Indicator Settings and Configuration
This indicator comes with a wide range of settings to customize its behavior and appearance.
Main Settings
length1(Default: 5): The period for the fast EMA.length2(Default: 18): The period for the slow EMA. Note: The code logic sets this tolength1 + 13.midL(Default: 1 – true): Set to1to display the 50% midline of the order blocks, or0to hide it.trendShadow(Default: 1 – true): Set to1to display the colored cloud between the EMAs, or0to hide it.showLastN(Default: 100): Sets the maximum number of historical blocks to draw on the chart. This helps manage chart performance.showbroken(Default: 1 – true): A very useful setting for analysis. When set to1(true), the indicator will continue to display blocks after they have been broken (they will stop extending). Set to0(false) to have broken blocks disappear immediately.
Color Settings
The indicator provides full control over all visual elements:
col1R, col1G, col1B: RGB color for the bullish EMA shadow.col2R, col2G, col2B: RGB color for the bearish EMA shadow.bullColorR, bullColorG, bullColorB: RGB color for the Bullish (Demand) Blocks.bearColorR, bearColorG, bearColorB: RGB color for the Bearish (Supply) Blocks.
ProRealtime Code
|
1 2 3 4 5 6 7 8 9 10 11 12 13 14 15 16 17 18 19 20 21 22 23 24 25 26 27 28 29 30 31 32 33 34 35 36 37 38 39 40 41 42 43 44 45 46 47 48 49 50 51 52 53 54 55 56 57 58 59 60 61 62 63 64 65 66 67 68 69 70 71 72 73 74 75 76 77 78 79 80 81 82 83 84 85 86 87 88 89 90 91 92 93 94 95 96 97 98 99 100 101 102 103 104 105 106 107 108 109 110 111 112 113 114 115 116 117 118 119 120 121 122 123 124 125 126 127 128 129 130 131 132 133 134 135 136 137 138 139 140 141 142 143 144 145 146 147 148 149 150 151 152 153 154 155 156 157 158 159 160 161 162 163 164 165 166 167 168 169 170 171 172 173 174 175 176 177 178 179 180 181 182 183 184 185 186 187 188 189 190 191 192 193 194 195 196 197 198 199 200 201 202 203 204 205 206 207 208 209 210 211 212 213 214 215 216 217 218 219 220 221 222 223 224 225 226 227 228 229 230 231 232 233 234 235 236 237 238 239 240 241 242 243 244 |
//---------------------------------- // PRC_Volume Order Blocks by BigBeluga // version = 0 // 12.11.2025 // Iván González @ www.prorealcode.com // Sharing ProRealTime knowledge //---------------------------------- DEFPARAM DRAWONLASTBARONLY = TRUE DEFPARAM CALCULATEONLASTBARS = 500 //---------------------------------- // INPUTS //---------------------------------- length1 = 5 // length2 = length1+13 // length1 + 13 midL = 1 // 1=true, 0=false. trendShadow = 1 // 1=true, 0=false. showLastN = 100 showbroken = 1 // 1=true, 0=false. // shadow color col1R = 38 col1G = 186 col1B = 159 col2R = 102 col2G = 38 col2B = 186 // block color bullColorR = 38 bullColorG = 186 bullColorB = 159 bearColorR = 102 bearColorG = 38 bearColorB = 186 //---------------------------------- // EMA CALCULATION //---------------------------------- ema1 = exponentialaverage[length1](close) ema2 = exponentialaverage[length2](close) crossUp = (ema1 crosses over ema2) crossDn = (ema1 crosses under ema2) //---------------------------------- // Shadow //---------------------------------- difff = ema2 - ema1 if difff>0 then colorShadowR=col2R colorShadowG=col2G colorShadowB=col2B else colorShadowR=col1R colorShadowG=col1G colorShadowB=col1B endif IF trendShadow THEN colorbetween(ema1, ema2,colorShadowR, colorShadowG, colorShadowB, 30) ENDIF //---------------------------------- // ATR calculation //---------------------------------- atrPeriod = 200 myAtr = averagetruerange[atrPeriod](close) atr = myAtr * 3 atr1 = myAtr * 2 //---------------------------------- //--- Bullish blocks detection //---------------------------------- ONCE b = 0 IF crossUp THEN myLowest = lowest[length2](low) myLowestIndex = 0 vol = 0 src = 0 i = 0 FOR i = 1 TO length2 DO IF low[i] = myLowest THEN myLowestIndex = barindex[i] src = min(open[i], close[i]) break endif next if myLowestIndex>0 then FOR k = 0 TO myLowestIndex DO vol = vol + volume[k] NEXT // ATR IF (src - myLowest) < (atr1 * 0.5) THEN src = myLowest + atr1 * 0.5 ENDIF // store block $bullIndex[b] = myLowestIndex $bullUpper[b] = src $bullLower[b] = myLowest $bullMid[b] = (src + myLowest) / 2 $bullVol[b] = vol $bullIsActive[b] = 1 $bullValid[b] = 1 b = b + 1 ENDIF ENDIF //---------------------------------- //--- Bearish blocks detection //---------------------------------- ONCE z = 0 IF crossDn THEN myHighest = highest[length2](high) myHighestIndex = 0 vol = 0 src = 0 i = 0 FOR i = length2 downTO 1 DO IF high[i] = myHighest THEN myHighestIndex = barindex[i] src = max(open[i], close[i]) break endif next FOR k = 0 TO myHighestIndex DO vol = vol + volume[k] NEXT // ATR IF (myHighest - src) < (atr1 * 0.5) THEN src = myHighest - atr1 * 0.5 ENDIF // Store block $bearIndex[z] = myHighestIndex $bearUpper[z] = myHighest $bearLower[z] = src $bearMid[z] = (src + myHighest) / 2 $bearVol[z] = vol $bearIsActive[z] = 1 $bearValid[z] = 1 z = z + 1 ENDIF //---------------------------------- // PLOT //---------------------------------- IF islastbarupdate THEN // --- 1. BULLISH BLOCKS (Invalidation) --- IF b > 0 THEN FOR i = 0 TO b - 1 DO IF $bullIsActive[i] = 1 THEN for j=barindex-$bullIndex[i] downto 0 do // A. Crossunder IF close[j] < $bullLower[i] THEN $bullIsActive[i] = 0 $bullIndexEnd[i] = barindex[j] break ENDIF // B. Overlap IF i > 0 AND $bullIsActive[max(0,i-1)] = 1 THEN dist = abs($bullMid[i] - $bullMid[i-1]) IF dist < atr[j] THEN $bullIsActive[i-1] = 0 $bullValid[i-1] = 0 ENDIF ENDIF next ENDIF NEXT ENDIF // --- 2. BEARISH BLOCKS (Invalidation) --- IF z > 0 THEN FOR i = 0 TO z - 1 DO IF $bearIsActive[i] = 1 THEN for j=barindex-$bearIndex[i] downto 0 do // A. Crossover IF close[j] > $bearUpper[i] THEN $bearIsActive[i] = 0 $bearIndexEnd[i] = barindex[j] break ENDIF // B. Overlap IF i > 0 AND $bearIsActive[max(0,i-1)] = 1 THEN dist = abs($bearMid[i] - $bearMid[i-1]) IF dist < atr[j] THEN $bearIsActive[i-1] = 0 $bearValid[i-1] = 0 ENDIF ENDIF next ENDIF NEXT ENDIF // --- 3. BULLISH BLOCKS --- IF b > 0 THEN startIndex = max(0, b - showLastN) FOR i = startIndex TO b - 1 DO IF $bullIsActive[i] = 1 THEN DRAWRECTANGLE($bullIndex[i], $bullLower[i], barindex, $bullUpper[i]) COLOURED(bullColorR, bullColorG, bullColorB) FILLCOLOR(bullColorR, bullColorG, bullColorB, 80) IF midL THEN DRAWSEGMENT($bullIndex[i], $bullMid[i], barindex, $bullMid[i]) COLOURED(bullColorR, bullColorG, bullColorB) STYLE(dottedline) ENDIF bullvol= $bullVol[i] drawtext("#bullvol#",barindex+5,$bullMid[i]) elsif $bullValid[i] = 1 AND showbroken then DRAWRECTANGLE($bullIndex[i], $bullLower[i], $bullIndexEnd[i], $bullUpper[i]) COLOURED(bullColorR, bullColorG, bullColorB,80) FILLCOLOR(bullColorR, bullColorG, bullColorB, 40) ENDIF NEXT ENDIF // --- 4. BEARISH BLOCKS --- IF z > 0 THEN startIndex = max(0, z - showLastN) FOR i = startIndex TO z - 1 DO IF $bearIsActive[i] = 1 THEN DRAWRECTANGLE($bearIndex[i], $bearLower[i], barindex, $bearUpper[i]) COLOURED(bearColorR, bearColorG, bearColorB) FILLCOLOR(bearColorR, bearColorG, bearColorB, 80) IF midL THEN DRAWSEGMENT($bearIndex[i], $bearMid[i], barindex, $bearMid[i]) COLOURED(bearColorR, bearColorG, bearColorB) STYLE(dottedline) ENDIF bearvol= $bearVol[i] drawtext("#bearvol#",barindex+5,$bearMid[i]) elsif $bearValid[i] = 1 AND showbroken then DRAWRECTANGLE($bearIndex[i], $bearLower[i], $bearIndexEnd[i], $bearUpper[i]) COLOURED(bearColorR, bearColorG, bearColorB,80) FILLCOLOR(bearColorR, bearColorG, bearColorB, 40) ENDIF NEXT ENDIF ENDIF //---------------------------------- RETURN ema1 as "EMA fast", ema2 as "EMA slow" |
Share this
No information on this site is investment advice or a solicitation to buy or sell any financial instrument. Past performance is not indicative of future results. Trading may expose you to risk of loss greater than your deposits and is only suitable for experienced investors who have sufficient financial means to bear such risk.
ProRealTime ITF files and other attachments :
Find other exclusive trading pro-tools on ![]()
PRC is also on YouTube, subscribe to our channel for exclusive content and tutorials


Ma non è uguale allo Smart Money Concept
No, non è la stessa cosa. Basta guardare il modo in cui vengono calcolati i pivot.
Quale dei due mi consigli di usare?
A me piacciono i concetti dello smart money, ma è solo la mia opinione.