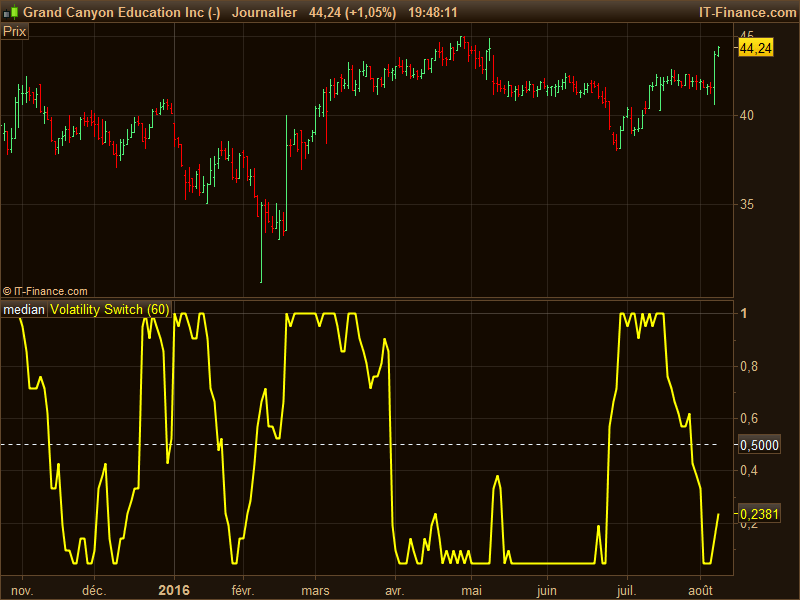
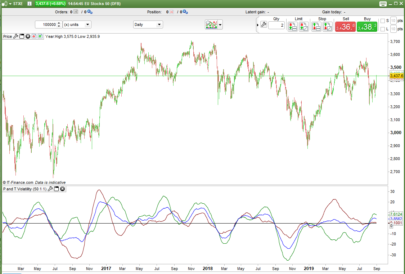
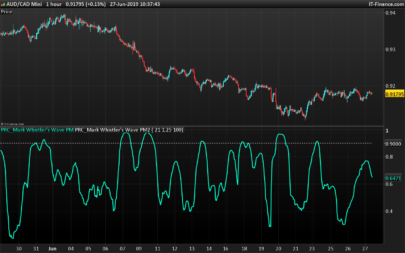
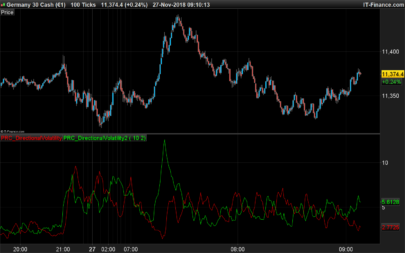
The Volatility Switch (VOLSWITCH) indicator, by Ron McEwan, estimates current volatility in respect to historical data, thus indicating whether the market is trending or in mean reversion mode. Range is normalized to 0 – 1.
When Volatility Switch rises above the 0.5 level, volatility in the market is increasing, thus the price action can be expected to become choppier with abrupt moves. When the indicator falls below the 0.5 level from recent high readings, volatility decreases, which may be considered a sign of trend formation.
Trading strategy as suggested by Ron McEwan is:
– If VOLSWITCH is less than 0.5, volatility decreases, which may be considered a sign of trend formation
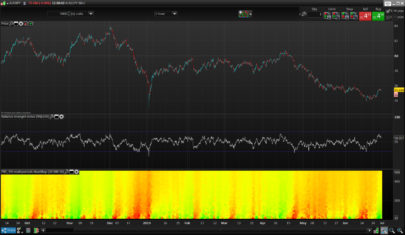
– If VOLSWITCH is greater than 0.5, market is in high volatility mode. Can be choppy. Use RSI to look for OB/OS levels.
|
1 2 3 4 5 6 7 8 9 |
// parameter //period=21 dr= roc[1](close)/average[2](close) vola21=std[period](dr) vswitch21=((vola21[1] <= vola21 ) + (vola21[2] <= vola21 ) + (vola21[3] <= vola21 ) + (vola21[4] <= vola21 ) + (vola21[5] <= vola21 ) + (vola21[6] <= vola21 ) + (vola21[7] <= vola21 ) + (vola21[8] <= vola21 ) + (vola21[9] <= vola21 ) + (vola21[10] <= vola21 ) + (vola21[11] <= vola21 ) + (vola21[12] <= vola21 ) + (vola21[13] <= vola21 ) + (vola21[14] <= vola21 ) + (vola21[15] <= vola21 ) + (vola21[16] <= vola21 ) + (vola21[17] <= vola21 ) + (vola21[18] <= vola21 ) + (vola21[19] <= vola21 ) + (vola21[20] <= vola21 ) + 1) / 21 RETURN 0.5 as "median", vswitch21 as "Volatility Switch" |
converted from LazyBear Pinescript code from TV.
Share this
No information on this site is investment advice or a solicitation to buy or sell any financial instrument. Past performance is not indicative of future results. Trading may expose you to risk of loss greater than your deposits and is only suitable for experienced investors who have sufficient financial means to bear such risk.
ProRealTime ITF files and other attachments :
Find other exclusive trading pro-tools on ![]()
PRC is also on YouTube, subscribe to our channel for exclusive content and tutorials


Perfect for counter-trend scalping. I like this!
Hi Nicolas! Great work you’ve done with all your indicators. Just wondering about the code above, im guessing the boolean condtion outputs 1 if True? Thanks
the value is not a boolean but an average of an addition of booleans. As stated in the description, this is how you should read it:
– If VOLSWITCH is less than 0.5, volatility decreases, which may be considered a sign of trend formation
– If VOLSWITCH is greater than 0.5, market is in high volatility mode. Can be choppy. Use RSI to look for OB/OS levels.