

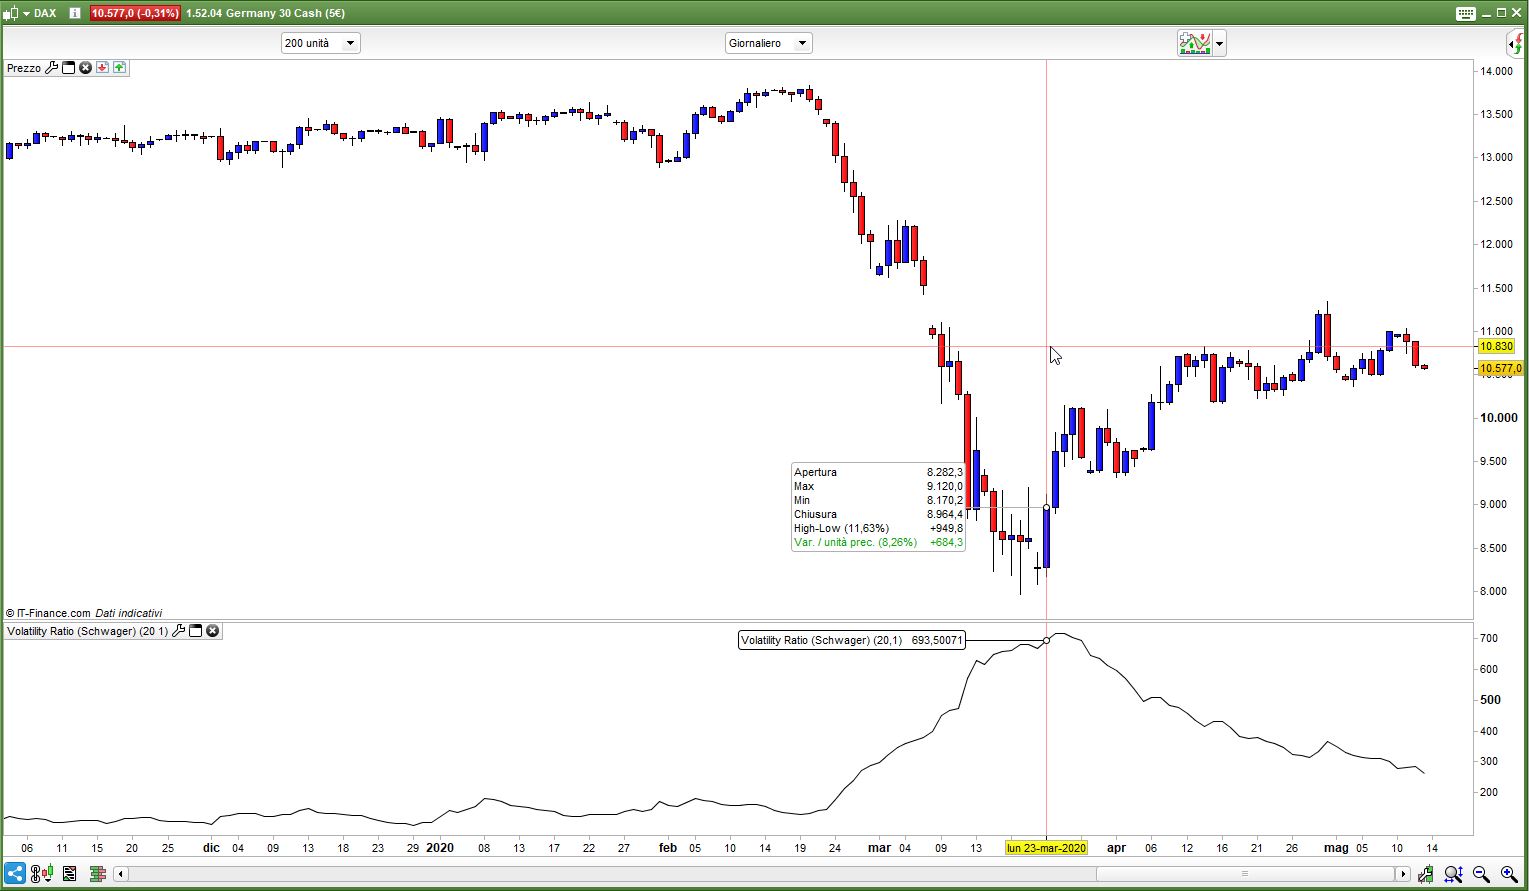
Volatility Ratio (Schwager)
What is Volatility Ratio
The volatility ratio is a technical measure used to identify price patterns and breakouts. In technical analysis it uses true range to gain an understanding of how a security’s price is moving on the current day in comparison to its past volatility.
BREAKING DOWN Volatility Ratio
The volatility ratio is a measure that helps investors follow the volatility of a stock’s price. It is one of a few technical indicators focused on volatility. In general, standard deviation is typically one of the most common measures used for following volatility. Standard deviation forms the basis for several technical channels including Bollinger Bands. Comprehensively envelope channels of many different varieties are used by technical analysts to identify price ranges and volatility patterns that help lead to trading signals. Historical volatility is also another common trendline that can be used to follow volatility.
The volatility ratio was developed to contribute to the analysis of price volatility. Across the industry volatility and volatility ratio calculations may vary. For technical analysis, Jack Schwager is known for introducing the concept of a volatility ratio in his book “Technical Analysis.”
Calculating the Volatility Ratio
Schwager’s methodology for calculating the volatility ratio builds on the concept of true range which was developed and introduced by Welles Wilder but has several iterations.
VR = TTR / ATR
where: VR = Volatility Ratio
TTR = Today’s True Range
Today’s True Range = Max − Min
Max = Today’s High, Yesterday’s Close
Min = Today’s Low, Yesterday’s Close
ATR = Average True Range of the Past N-Day Period
Volatility Ratio (Schwager)
https://www.investopedia.com/terms/v/volatility-ratio.asp
https://www.incrediblecharts.com/indicators/volatility_ratio_schwager.php
DEFPARAM CalculateOnLastBars = 1000
//Periods    = 20
//AvgT       = 0
Periods      = max(1,min(999,Periods))
AvgT         = max(0,min(6,AvgT))
MyTR1        = high - low
MyTR2        = high - close[1]
MyTR3        = close[1] - low
MyTrueRange  = max(MyTR1,max(MyTR2,MyTR3))
VolatilRatio = average[Periods,AvgT](MyTrueRange)
RETURN VolatilRatio AS "Volatility Ratio (Schwager)"
