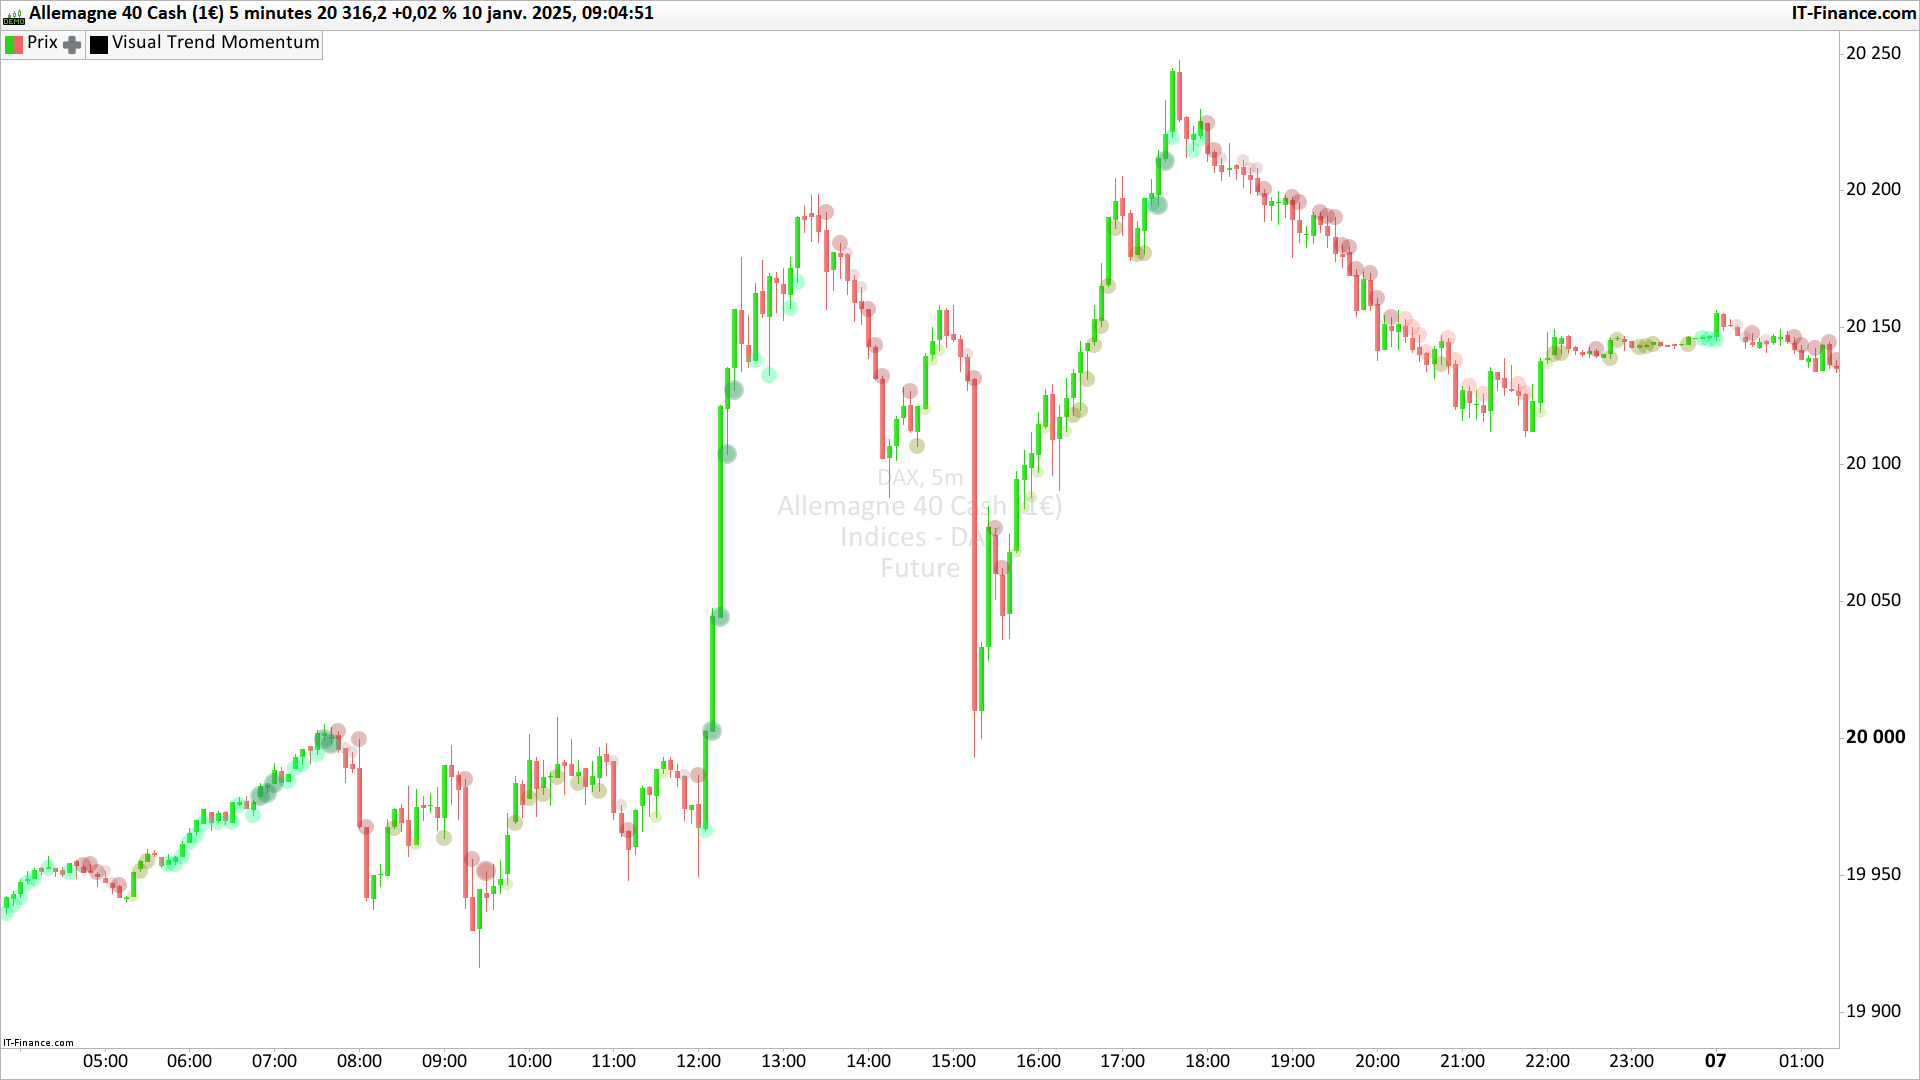
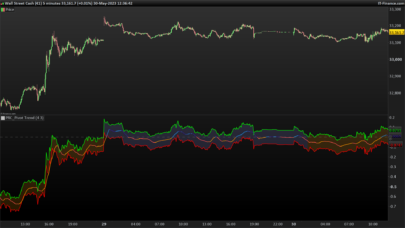
The Visual Trend Momentum is a technical analysis tool designed to help traders identify trading opportunities through an intuitive visual approach. This indicator combines multiple technical aspects including trend analysis, volatility measurements, and volume confirmation to provide clear market signals.
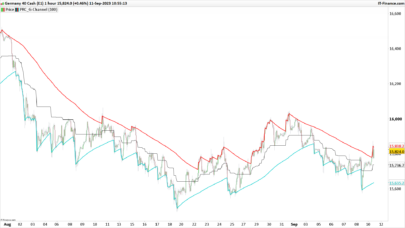
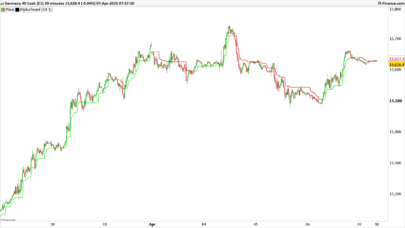
At its core, VTM uses a triple moving average system (8, 21, and 55 periods) to determine the market’s directional bias. This approach can help to distinguish between strong and weak trends, providing a more nuanced view of market conditions. The indicator automatically detects trend alignments and highlights potential trading opportunities through a visual system.
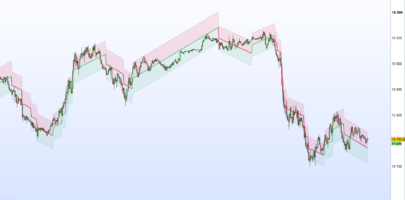
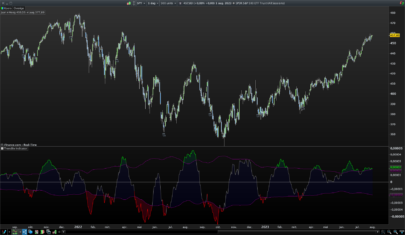
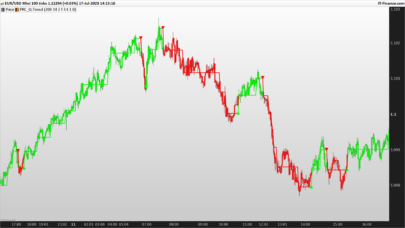
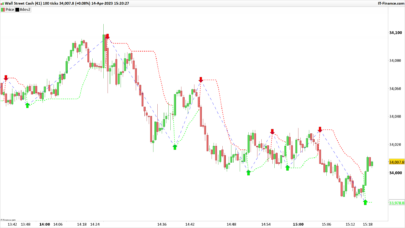
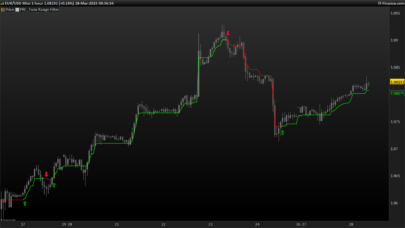
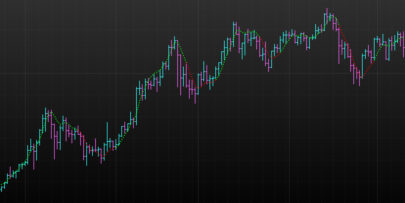
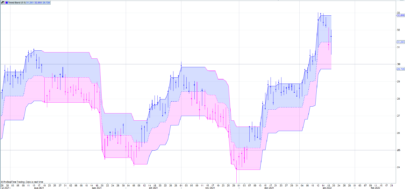
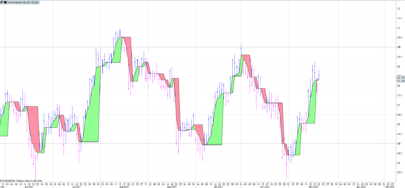
The visual output is designed for instant pattern recognition. Strong bullish signals are displayed in various shades of green, while bearish signals use different red gradients. The size and opacity of the markers vary based on the signal’s strength, creating an intuitive visual hierarchy. Special golden zones mark trend reversals, helping traders identify potential turning points in the market.
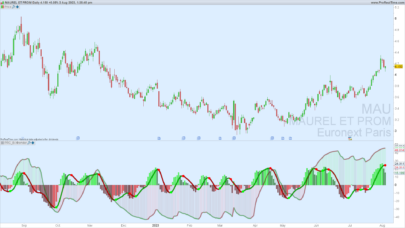
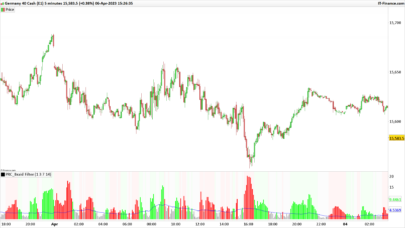
Volume analysis adds another layer of confirmation to the system. The indicator monitors volume levels and identifies situations where increased trading activity supports the price action, helping to validate potential trade signals. This multi-faceted approach helps traders focus on the most significant market moves while filtering out noise.
Whether you’re a day trader or swing trader, this indicator provides valuable insights into market conditions and potential opportunities. Its visual nature makes it particularly useful for quick decision-making while maintaining a structured approach to market analysis.
|
1 2 3 4 5 6 7 8 9 10 11 12 13 14 15 16 17 18 19 20 21 22 23 24 25 26 27 28 29 30 31 32 33 34 35 36 37 38 39 40 41 42 43 44 45 46 47 48 49 50 51 52 53 54 55 56 57 58 59 60 61 62 63 64 65 66 67 68 69 70 71 72 73 74 75 76 77 78 79 80 81 82 83 84 85 86 87 88 |
//Visual Trend Momentum - Thibauld Robin //================================================ // === VOLATILITY CALCULATIONS === TrueRange = MAX(MAX(HIGH - LOW, ABS(HIGH - CLOSE[1])),ABS(LOW - CLOSE[1])) ShortATR = AVERAGE[10](TrueRange) MediumATR = AVERAGE[20](TrueRange) LongATR = AVERAGE[50](TrueRange) SignificantVolume = AVERAGE[50](VOLUME) * 2 PriceRange = MediumATR * 0.5 // === MOVING AVERAGES === FastMA = AVERAGE[8](CLOSE) MediumMA = AVERAGE[21](CLOSE) SlowMA = AVERAGE[55](CLOSE) // === Trend Detection=== StrongBuy = CLOSE > OPEN AND CLOSE > FastMA AND FastMA > MediumMA AND MediumMA > SlowMA StrongSell = CLOSE < OPEN AND CLOSE < FastMA AND FastMA < MediumMA AND MediumMA < SlowMA WeakBuy = CLOSE > OPEN AND CLOSE > FastMA AND NOT StrongBuy WeakSell = CLOSE < OPEN AND CLOSE < FastMA AND NOT StrongSell // === Vol LEVELS === Vol4 = ABS(CLOSE - FastMA) > ShortATR * 0.5 Vol8 = ABS(CLOSE - MediumMA) > MediumATR * 0.75 Vol12 = ABS(CLOSE - SlowMA) > LongATR AND VOLUME > SignificantVolume Vol16 = Vol12 AND VOLUME > HIGHEST[20](VOLUME[1]) AND HIGH - LOW < PriceRange // === TREND CHANGE DETECTION === TrendChange = (StrongBuy AND StrongSell[1]) OR (StrongSell AND StrongBuy[1]) // === VISUALIZATION STRONG BUY CLUSTERS === IF StrongBuy THEN IF Vol16 THEN drawpoint(BarIndex, LOW, 5) coloured("darkgreen", 90) drawpoint(BarIndex, LOW, 4) coloured("forestgreen", 80) drawpoint(BarIndex, LOW, 3) coloured("green", 70) IF TrendChange THEN drawarrowup(BarIndex, LOW - (LongATR * 0.5)) coloured("gold") ENDIF ELSIF Vol12 THEN drawpoint(BarIndex, LOW, 5) coloured("seagreen", 85) drawpoint(BarIndex, LOW, 4) coloured("mediumseagreen", 75) ELSIF Vol8 THEN drawpoint(BarIndex, LOW, 4) coloured("springgreen", 80) ELSIF Vol4 THEN drawpoint(BarIndex, LOW, 3) coloured("palegreen", 75) ENDIF ENDIF // === VISUALIZATION STRONG SELL CLUSTERS === IF StrongSell THEN IF Vol16 THEN drawpoint(BarIndex, HIGH, 5) coloured("darkred", 90) drawpoint(BarIndex, HIGH, 4) coloured("red", 80) drawpoint(BarIndex, HIGH, 3) coloured("crimson", 70) IF TrendChange THEN drawarrowdown(BarIndex, HIGH + (LongATR * 0.5)) coloured("gold") ENDIF ELSIF Vol12 THEN drawpoint(BarIndex, HIGH, 5) coloured("firebrick", 85) drawpoint(BarIndex, HIGH, 4) coloured("indianred", 75) ELSIF Vol8 THEN drawpoint(BarIndex, HIGH, 4) coloured("salmon", 80) ELSIF Vol4 THEN drawpoint(BarIndex, HIGH, 3) coloured("lightsalmon", 75) ENDIF ENDIF // === VISUALIZATION WEAK CLUSTERS === IF WeakBuy THEN IF Vol8 THEN drawpoint(BarIndex, LOW, 4) coloured("olive", 80) ELSIF Vol4 THEN drawpoint(BarIndex, LOW, 3) coloured("yellowgreen", 75) ENDIF ENDIF IF WeakSell THEN IF Vol8 THEN drawpoint(BarIndex, HIGH, 4) coloured("brown", 80) ELSIF Vol4 THEN drawpoint(BarIndex, HIGH, 3) coloured("rosybrown", 75) ENDIF ENDIF RETURN |
Share this
No information on this site is investment advice or a solicitation to buy or sell any financial instrument. Past performance is not indicative of future results. Trading may expose you to risk of loss greater than your deposits and is only suitable for experienced investors who have sufficient financial means to bear such risk.
ProRealTime ITF files and other attachments :
Find other exclusive trading pro-tools on ![]()
PRC is also on YouTube, subscribe to our channel for exclusive content and tutorials