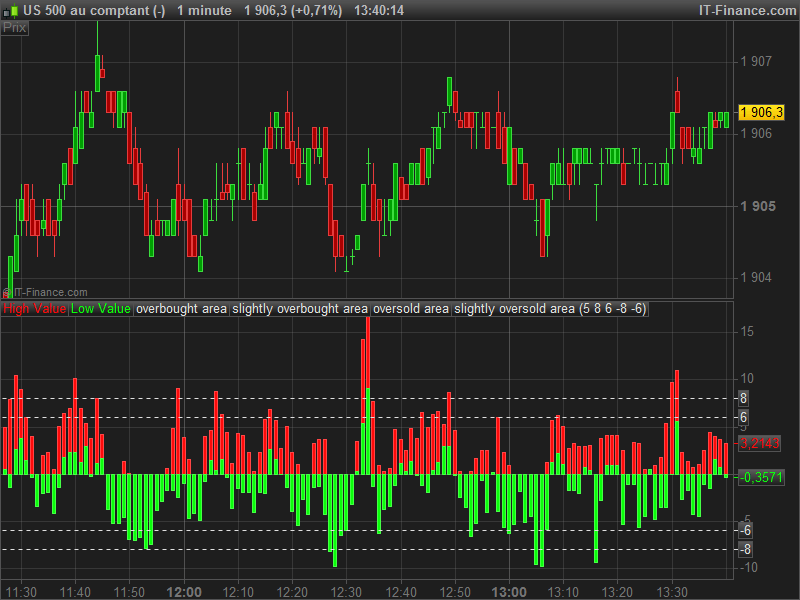
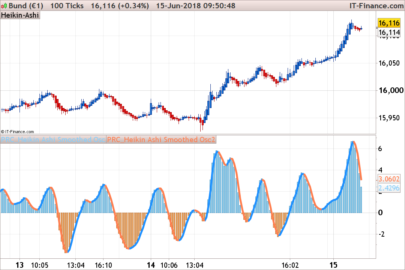
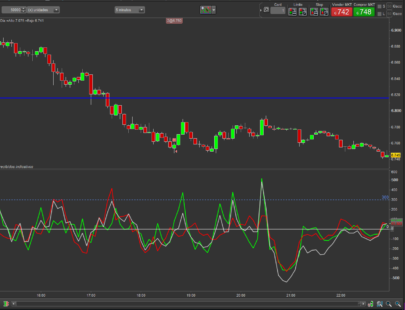
The original value chart is made of OHLC candlesticks drowned on a normalized scale. This one only reflect high and low values, that are more useful for its purpose.
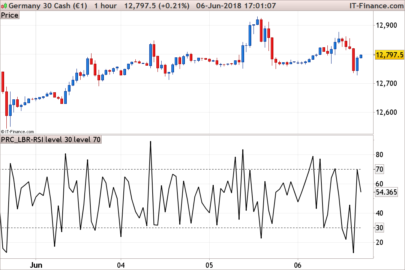
This indicator is popular in scalping trading and short-term binary options because of its effectiveness to spot prices excess on a relative short time scale. Period and overbought/oversold areas are configurable to fit your timeframe and trading method.
|
1 2 3 4 5 6 7 8 9 10 11 12 13 14 15 16 17 |
//parameters : //ExtDepth = 5 //Overbought = 8 //SlightlyOverbought = 6 //Oversold = -8 //SlightlyOversold = -6 sumHigh = summation[ExtDepth](high) sumLow = summation[ExtDepth](low) floatingaxis = 0.1 * (sumHigh+sumLow) volatilityunit = 0.04 * (sumHigh-sumLow) vcHigh = (high-floatingaxis) / volatilityunit vcLow = (low-floatingaxis) / volatilityunit RETURN vcHigh coloured(255,10,10) as "High Value", vcLow coloured(10,255,10) as "Low Value", Overbought as "overbought area", SlightlyOverbought as "slightly overbought area", Oversold as "oversold area", SlightlyOversold as "slightly oversold area" |
Share this
No information on this site is investment advice or a solicitation to buy or sell any financial instrument. Past performance is not indicative of future results. Trading may expose you to risk of loss greater than your deposits and is only suitable for experienced investors who have sufficient financial means to bear such risk.
ProRealTime ITF files and other attachments :
Find other exclusive trading pro-tools on ![]()
PRC is also on YouTube, subscribe to our channel for exclusive content and tutorials


Very nice, thanks for your contribution. Next generation of the platform will have the ability to draw custom candlestick with only a simple instruction, then we’ll can make this indicator entirely without restriction. You can have a look on the new DRAWCANDLESTICK instruction here : http://www.prorealcode.com/documentation/drawcandle/
Drawing Bar chart will be also possible with the instruction DRAWBARCHART : http://www.prorealcode.com/documentation/drawbarchart/
very interesting, do you know when it will be available to everyone?
Don’t really know it. I only have a VIP Beta access and it looks promising. A lot of improvements have been made for indicators development and beyond. Of course i’ll give news here in ProRealCode as soon as possible.
I already have investigated in new drawing capabilities and it is awesome! At least, we can do almost anything for chart drawing. Our imagination the limit 🙂
Well, i’ll look forward for it. Cant wait.Thank you Nicolas!
For your interest i have coded the ProRealTime next generation version of this indicator, with all the OHLC value. I’m talking about it here in the forum : http://www.prorealcode.com/topic/the-next-prorealtime-version-10-3-and-new-graphical-functionnalities/#post-3316
Salut Nicolas,
for me the chart shows up as 2 lines. what does it mean “high value” and “low value”? is it enough for the “high value” to be oversold to trigger a signal or do both lines have to be above?
Merci
Only high for short signal and low for long signal are important.
Nice indicator. It might be a newbie question, but what kind of candlesticks are visible on the upper part of the chart? They are kind of equalized. Thank you.
Don’t remember but they seem to be normal candlesticks to me. In 1 minute time frame there not much ticks.
This was my first thought, but 1 minute bars don’t look like these on my charts. Hmm…
It’s SP500 before Wall Street open.
I will be looking into it. Thank you for responding!