1. Introduction
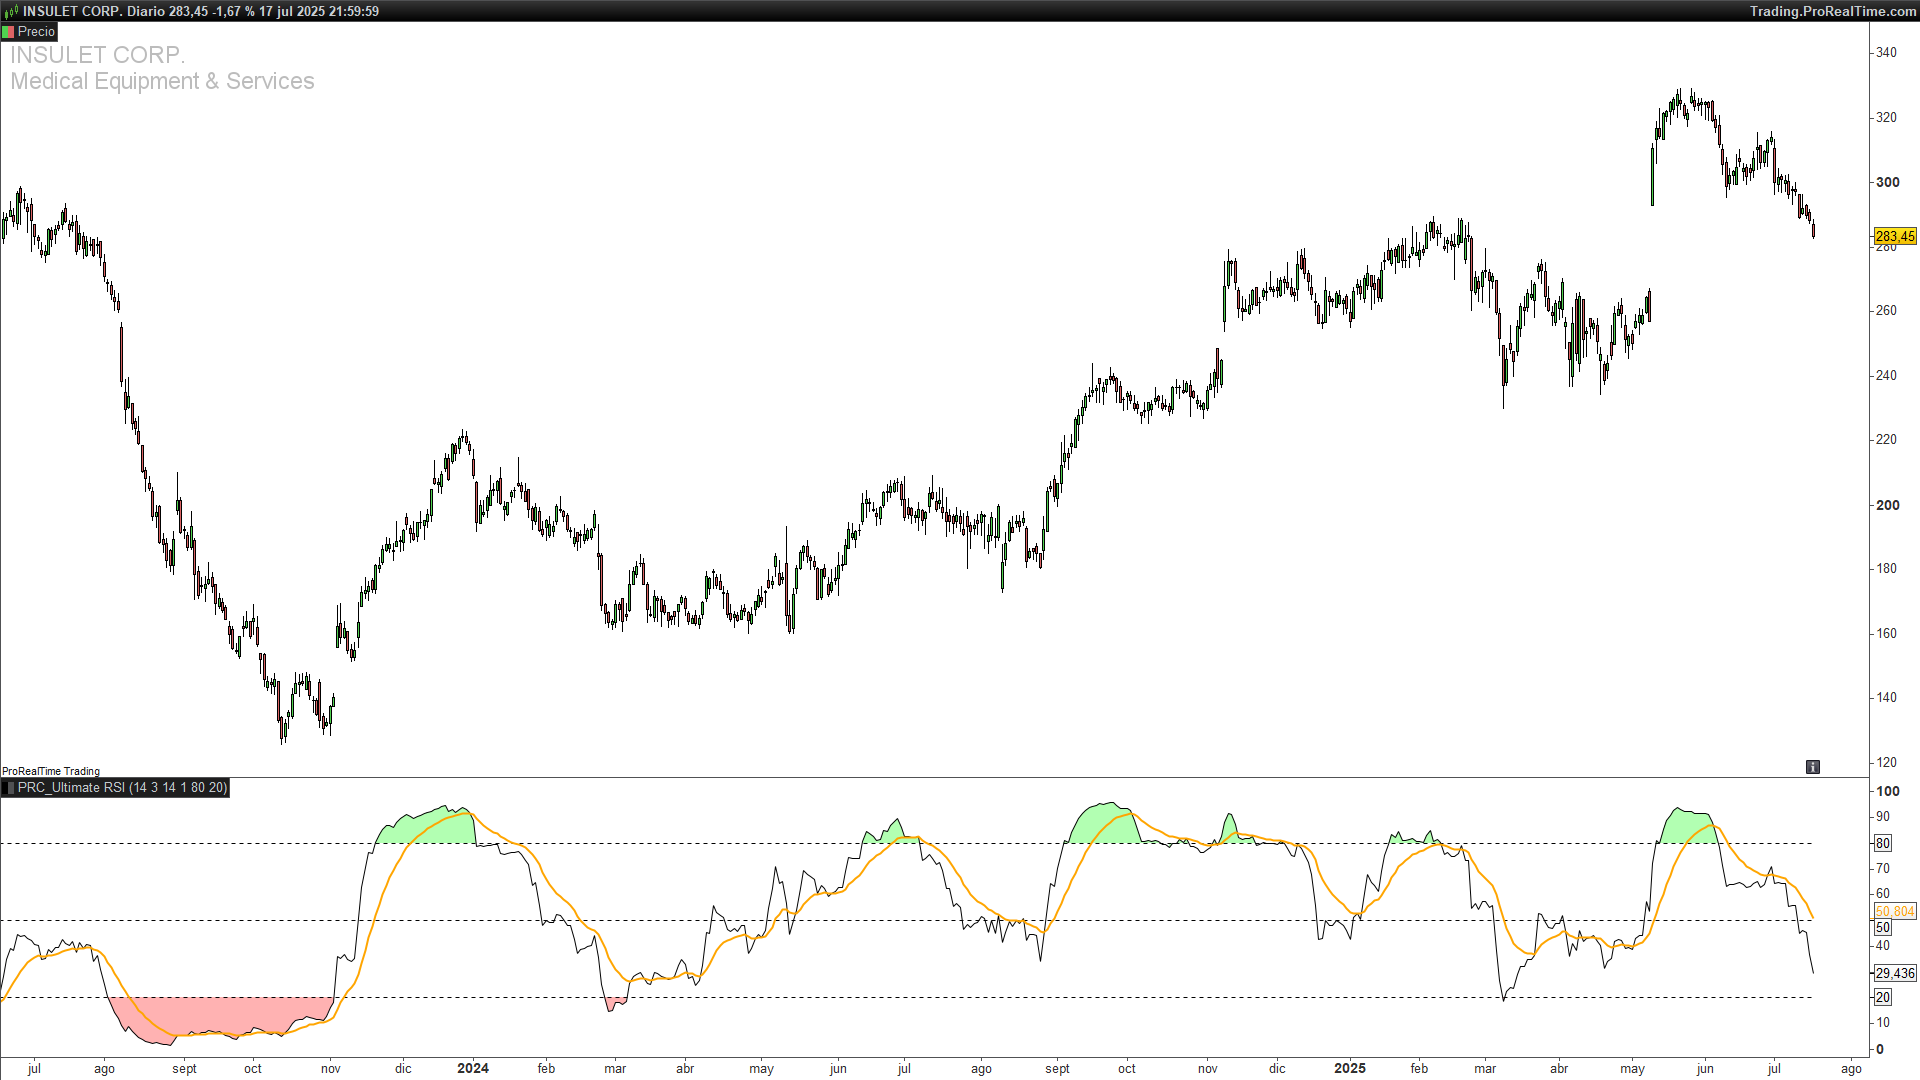
The Ultimate RSI by LuxAlgo is an enhanced version of the classic Relative Strength Index (RSI), designed to provide smoother, more responsive momentum readings and clearer overbought/oversold signals.
By combining an “augmented” computation of price change with selectable smoothing methods and a dedicated signal line, this indicator aims to reduce whipsaws and highlight only the most reliable turning points in price action.
2. What Is the Ultimate RSI?
The Ultimate RSI builds upon the traditional RSI by:
-
Augmented Price Difference: Instead of simply using the raw change in price, it adjusts differences when new highs or lows occur over the lookback period, strengthening signals when momentum breaks out.
-
Customizable Smoothing: Offers multiple smoothing types (Simple, Exponential, Wilder’s, Double SMAs) for both the numerator and denominator of the RSI calculation, as well as for its signal line.
-
Dedicated Signal Line: A moving average of the RSI itself that can be tuned separately, making crossovers more meaningful.
Compared to a standard RSI, the Ultimate RSI filters out noise more effectively, helping traders focus on sustained momentum shifts rather than fleeting spikes.
3. How It Works and Is Calculated
-
Define Inputs
-
length: lookback period for highs/lows and smoothing (default 14) -
smotype1: type of smoothing for the augmented RSI (1=SMA, 2=Wilder, 3=EMA, 4=Double SMA) -
src: price series (defaultclose) -
smooth: period for the signal line moving average (default 14) -
smotype2: smoothing type for the signal line (same options as above) -
obValue/osValue: overbought/oversold thresholds (default 80/20)
-
-
Augmented Price Range
Computes the high–low range over
length. -
Adjusted Price Difference (
diff)Strengthens moves when price breaks the recent range.
-
Compute Smoothed A-RSI (
arsi)-
Apply chosen smoothing (
smotype1) separately todiff(numerator) andabs(diff)(denominator). -
Calculate:
1arsi = num/den * 50 + 50Places values between 0 and 100.
-
-
Signal Line
-
Smooth the
arsiseries oversmoothbars usingsmotype2. -
Encourages crossovers to act as clearer entry/exit triggers.
-
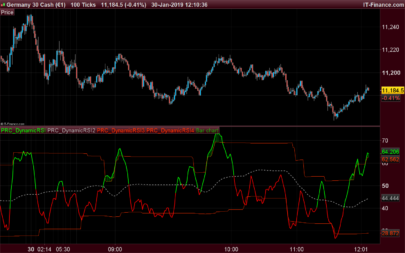
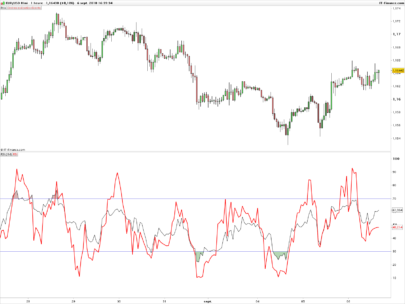
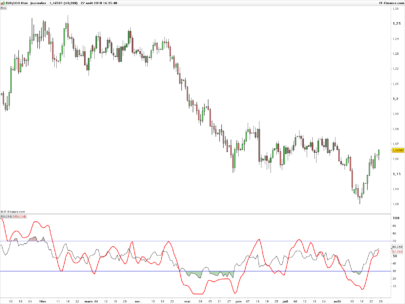
4. Interpreting Signals
-
Overbought/Oversold Levels
-
Readings above 80 suggest overbought conditions; below 20, oversold.
-
Colored bands appear behind the
arsiline to highlight these zones.
-
-
RSI / Signal Crossovers
-
A bullish entry is flagged when
arsicrosses above its signal line in or near the oversold region. -
A bearish exit (or short entry) occurs when
arsicrosses below its signal line near overbought.
-
-
Avoiding Noise
-
By reinforcing momentum only on genuine highs/lows and applying robust smoothing, the Ultimate RSI aims to ignore choppy, indecisive price moves.
-
5. Inputs and Configuration
| Parameter | Default | Description |
|---|---|---|
length |
14 | Lookback for highs/lows and smoothing. |
smotype1 |
3 (EMA) | Smoothing for the augmented RSI: 1=SMA, 2=Wilder’s, 3=EMA, 4=Double SMA. |
src |
Close | Source price series. |
smooth |
14 | Period for the signal line moving average. |
smotype2 |
1 (SMA) | Smoothing for the signal line (same options as smotype1). |
obValue |
80 | Overbought threshold. |
osValue |
20 | Oversold threshold. |
-
Adjusting Sensitivity
-
Shorter
length→ more responsive but risk of noise. -
Longer
length→ smoother, fewer signals. -
Higher smoothing types (e.g., Wilder’s) tend to lag more but filter noise.
-
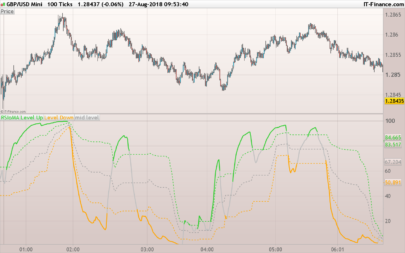
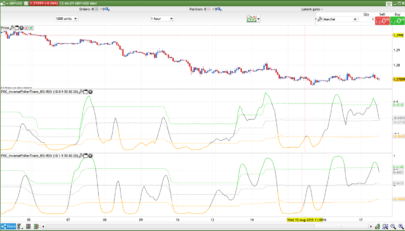
6. Practical Usage Examples
-
Trend Confirmation on Daily Chart
-
Use default settings to confirm daily momentum before following breakouts.
-
Only take signals when the broader trend (e.g., 50-bar moving average) aligns.
-
-
Fast Entries on Lower Timeframes
-
Reduce
lengthto 8–10, switchsmotype1to EMA for quicker response. -
Use the crossover of
arsiabove signal near the 30 level for long entries.
-
-
Divergence Detection
-
Plot price highs/lows against Ultimate RSI peaks/troughs.
-
Look for hidden or regular divergences to anticipate reversals.
-
7. Code
Below is the full ProBuilder script for the Ultimate RSI. Each section is annotated for clarity:
8. Conclusion and Final Tips
The Ultimate RSI from LuxAlgo offers a sophisticated twist on the classic oscillator, combining dynamic range detection with flexible smoothing to deliver clearer, more actionable momentum readings. To get the most out of it:
-
Align entries with higher-timeframe trends.
-
Experiment with smoothing types to find your ideal balance of responsiveness vs. noise filtering.
-
Use the signal line crossovers in conjunction with traditional support/resistance or chart patterns.
Share this
No information on this site is investment advice or a solicitation to buy or sell any financial instrument. Past performance is not indicative of future results. Trading may expose you to risk of loss greater than your deposits and is only suitable for experienced investors who have sufficient financial means to bear such risk.
ProRealTime ITF files and other attachments :
Find other exclusive trading pro-tools on ![]()
PRC is also on YouTube, subscribe to our channel for exclusive content and tutorials