True Strength Index TSI

True Strength Index TSI

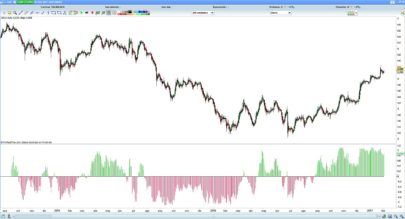
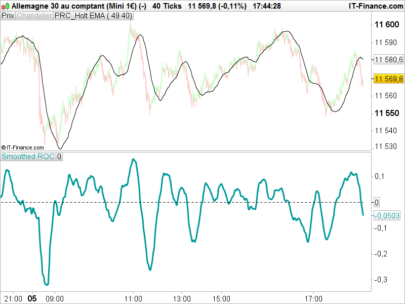
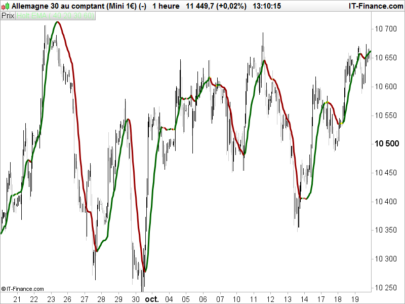
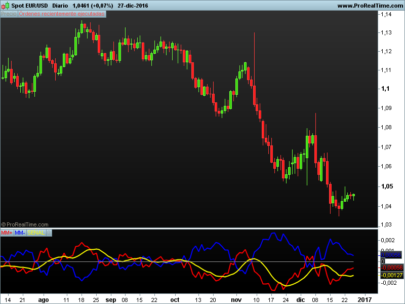
The true strength index (TSI) is a technical indicator used in the analysis of financial markets that attempts to show both trend direction and overbought/oversold conditions. It was first published William Blau in 1991. The indicator uses moving averages of the underlying momentum of a financial instrument. Momentum is considered a leading indicator of price movements, and a moving average characteristically lags behind price. The TSI combines these characteristics to create an indication of price and direction more in sync with market turns than either momentum or moving average. (source: wikipedia)


Share this

Risk disclosure:

No information on this site is investment advice or a solicitation to buy or sell any financial instrument. Past performance is not indicative of future results. Trading may expose you to risk of loss greater than your deposits and is only suitable for experienced investors who have sufficient financial means to bear such risk.

ProRealTime ITF files and other attachments : How to import ITF files into ProRealTime platform?

PRC is also on YouTube, subscribe to our channel for exclusive content and tutorials

  1. Martial Schaff • 10/26/2015 #

    Hello,
    The formula you describe in this post is not the same as in the prorealtime tool (predefined indicators).
    Could you please show the formula used in prorealtime?
    Thanks

  2. Dunkelmann • 10/26/2015 #

    I think if you substitute Momentum for ROC in the code you get the tool values.

  3. marzibre • 10/26/2015 #

    Hello Nicholas I confirm you that the formula it is not the same. Could you please give me a link where I can find the predifined code of True Strenght Index? I need to it to take as example to create the True Directional Index (another William Blau indicator)

  4. gelex911 • 10/26/2015 #

    I confirm too that the formula given above differs from the predefined TSI. Why this missmatch?

  5. Bateson • 10/26/2015 #

    Bonjour.
    L’indicateur fonctionne remarquablement.
    Je n’arrive cependant pas à l’intégrer dans une stratégie “croisement TSI / TMA”. Pourriez-vous m’indiquer comment faire ?
    Cordialement

  6. Fernando • 10/26/2015 #

    Hi I had same problem, so I translated from NinjaTrader TSI’s formula to PRT code, seems the same values now!

    Fast = 3
    Slow = 14

    constant1 = 2 / (1 + Slow)
    constant2 = 1 – (2 / (1 + Slow))
    constant3 = 2 / (1 + Fast)
    constant4 = 1 – (2 / (1 + Fast))

    IF BarIndex = 0 THEN
    fastAbsEma = 0
    fastEma = 0
    slowAbsEma = 0
    slowEma = 0
    Valor = 0
    ELSE
    momento = Close[0] – Close[1]
    slowEma = momento * constant1 + constant2 * slowEma
    fastEma = slowEma * constant3 + constant4 * fastEma
    slowAbsEma = Abs(momento) * constant1 + constant2 * slowAbsEma
    fastAbsEma = slowAbsEma * constant3 + constant4 * fastAbsEma[1]
    IF fastAbsEma = 0 THEN
    Valor = 0
    ELSE
    Valor = 100 * fastEma[0] / fastAbsEma[0]
    ENDIF
    ENDIF

    Return Valor AS “TSI”

avatar
Register or

Likes

avatar
Related users ' posts
corzaroja
8 years ago
julien1978 The ADR value that is plotted intraday does not match the value of the regular ATR indicator...
Fab666 I've tried to get a fix for this also but no luck, it doesn't print the correct data as far ...
Seabiscuit Hi! With the new PRT update, this indicator does not work anymore
Wing Yes, investigate as much as you want. For more insight, you can view the linet1, linet2 etc....
CKW Hi Wing, Thanks for your sharing. I am still trying to breakdown & understand your code...
Wing Hello CKW. No, the parameter, 7 in this case, is used when calling the RSI indicator to ide...
rafadonl2 Prueba la nueva version que acabo que poner. Incluye regresion lineal y elimina señales en t...
rafadonl2 prueba la nueva version que acabo de poner. Usa regresion lineal y elimina muchas señales en...
rafadonl2 te adjunto el código. //Reglas en Heikin-Ashi: //1- Secuencia de cuerpos verdes = tenden...
Sofitech Ce code n'est valable que sur la V10.3 ? sur le 10.2 il y a une erreur de syntaxe dans le fi...
Nicolas Oui en effet, c'est un indicateur "10.3" à cause uniquement de la mise en forme des courbes ...
Nicolas En effet, c'est le cas si on copie/colle le code. Ces 2 variables sont inscrites en externes...
Salocin Hello Nicolas, my french is not that well. It occurs an error which can not be solved by cop...
Nicolas Just download the ITF file and import it into your platform, follow these easy steps: https:...
Nicolas You need to have enough bars loaded on your chart for the indicator to compute completely th...
verdi55 Working with separately calculated supertrend indicators in backtests is usually somewhat pr...
Nicolas Very interesting Verdi. Would be a great addition to the library, your own modified version ...
tatankayotanka
8 years ago
T3 Velocity mix
T3 Velocity mix
4
Indicators
Maximus Hello, I have not found better tool for analyzing divergences. Congrats !
tatankayotanka Ciao , tu come lo usi?
Fabius965 Ciao tatankayotanka.....ho provato a caricare il tuo indicatore ciclico, ma quando chiedo la...
Rohan
8 years ago
gabri Great job!! I love everything that involve Ichimoku. Did you think about changing the line t...
Rohan Thanx gabri. Yes I did play around with the offset. It works but I like the "earlier" warnin...
Dom Dominics Hi, Is this code can be used for MT4 ?
Nicolas
8 years ago
Haos Visual
Haos Visual
8
Indicators
Lyny @Nicolas, how can i put this code in ProOder when for example i want to buy 1 share with con...
Nicolas Please open a new topic on forums for coding requests, I'll help you there. 
Johan Swarts Lyny / Nicolas Please advise whether you proceded with the code in ProOrder and if so where...
gabri Ichimoku is one of the best trend indicator ever together with the Guppy EMA's. I agree with...
primo1 thanks
traderkarnik Rohan, Have you tried encorporating momentum indicator? if waiting for future cross in your...
Bard Thanks for posting this indicator @Nicolas, I'm wondering if it's possible to have a % ROC s...
Nicolas Hi Bard, angle of a MA is nothing more than a ROC oscillation. I assume, that's why you foun...
bolsatrilera
8 years ago
Twiggs Money Flow
Twiggs Money Flow
6
Indicators
Nicolas https://www.prorealcode.com/documentation/average/ 0 = SMA 1 = EMA 2 = WMA 3 = Wilder 4 = Tr...
century thanks alot . it's all i need ;)
dcos Any ideas why this would return an empty chart? Imported the ITF and it doesn't seem to want...
Nicolas
8 years ago
Jurik MACD
Jurik MACD
1
Indicators
ramonjp Hi Nicolas, this sentence is correct?? ftmp0 = (1-falpha)*price + falpha*tmp0[1] I thi...
Nicolas
8 years ago
Gann HiLo activator
Gann HiLo activator
3
Indicators
maxxb salve,  vorrei sapere perchè nel suo grafico compare sul prezzo mentre a me compare a parte...
AleX Sul grafico principale accanto alla voce Prezzo (vedi in alto a sinistra proprio sotto l'are...
maxxb perfetto non lo sapevo ....  ciao grazie..     
Nicolas
9 years ago
Holt EMA
Holt EMA
1
Indicators
robertanthonyuk Hi,What do the each colour represent? Rob
bolsatrilera
9 years ago
MACD MIRROR
MACD MIRROR
0
Indicators
Pere
9 years ago

Top