







Daily timeframe SuperTrend on intraday chart
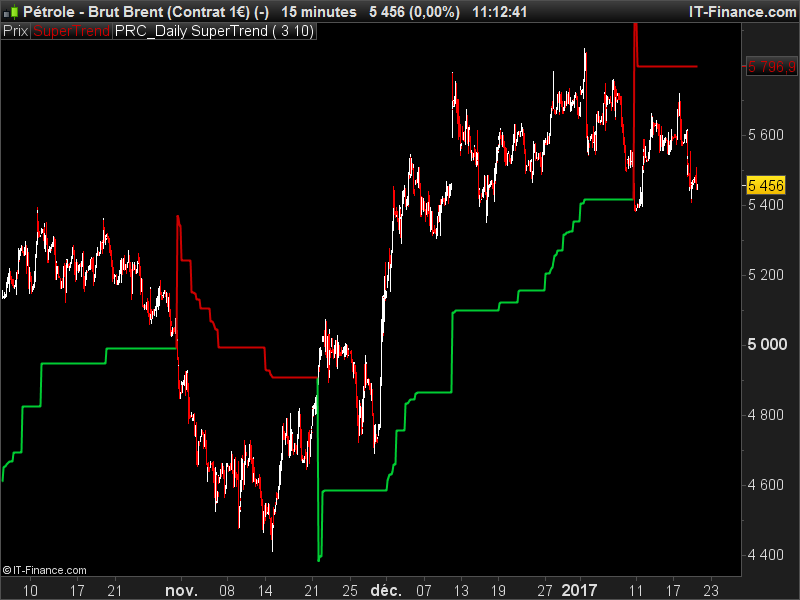
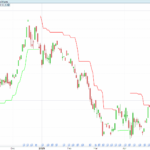
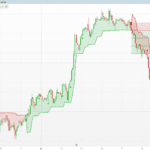
This is an attempt to draw the SuperTrend indicator made of daily OHLC values on inferior timeframe for intraday trading.
The idea came from a recent forum post where someone wanted to draw Average True Range information on intraday charts. Since SuperTrend is mainly made of ATR, here is the final result of my research on this. You already know that multi timeframe support is still not available for ProBuilder, so the result may differ a bit from the true daily timeframe SuperTrend. ATR is normally calculated with a Wilder Average, but I’m using a simple moving average here, that’s why you may notice differences. But, because I found it would be valuable, that’s why I’m sharing the indicator with the community.
If someone has an idea to calculate the real Wilder Average from daily OHLC in an intraday timeframe, I’d be pleased to help 🙂
//PRC_Daily SuperTrend | indicator
//19.01.2017
//Nicolas @ www.prorealcode.com
//Sharing ProRealTime knowledge

// --- parameters
//multiplier=3
//period=10
// ---

dTR = 0

for i = 0 to period
 dTR=dTR+max(abs(Dhigh(i)-Dlow(i)),max(abs(Dhigh(i)-Dclose(i+1)),abs(Dlow(i)-Dclose(i+1))))
next

moy = dTR/period

price=(dhigh(0)+dlow(0))/2
up=price+multiplier*moy
dn=price-multiplier*moy
once trend=1
if Dclose(0)>up[1] then
 trend=1
elsif Dclose(0)<dn[1] then
 trend=-1
endif
if trend<0 and trend[1]>0 then
 flag=1
else
 flag=0
endif
if trend>0 and trend[1]<0 then
 flagh=1
else
 flagh=0
endif
if trend>0 and dn<dn[1] then
 dn=dn[1]
endif
if trend<0 and up>up[1] then
 up=up[1]
endif
if flag=1 then
 up=price+multiplier*moy
endif
if flagh=1 then
 dn=price-multiplier*moy
endif
if trend=1 then
 mysupertrend=dn
else
 mysupertrend=up
endif

return mysupertrend coloured by (trend) as "SuperTrend"
Comments
You must be logged in to post a comment.

something wrong, I import the code file .itf into indicator to load, but there is only 1 straight line at bottom indicator area. It does not look as your picture. Can you check your code or advice me to do correctly. I am using Prorealtime v10.2. Even I tried load the indicator on Price but nothing draw out at all.
Working with separately calculated supertrend indicators in backtests is usually somewhat problematic, because calculation times are extremely long compared to the built-in supertrend indicator (something between 10 to 50 times longer, in my experience). It may be more practical to use the built-in supertrend for backtests and to modify buy and sell conditions : For example, set stop buy orders to the value of the last supertrend. Or : exclude buy entries when the supertrend is crossed (at the end of a bar) by a very short amount only, and try to enter later. This saves a lot of calculation time compared to calculating a supertrend oneself.
I have used the DEMA instead of Wilder's average for supertrend calculation (see the separate entry for the supertrend indicator) and got slightly better results in some cases, but this is paid again by a huge increase in calculation time. Also, using the average of the medianprice of the last two bars instead of the medianprice of the last bar only can smooth the supertrend and thus gives less signals. For very simple and short trading systems, this may lead to acceptable calculation time, but not for more complex ones on shorter timescales.