1) Introduction
TrendLine BreakOuts is a indicator inspired by the original concept created by ChartPrime. It automates the discovery of dynamic trendlines built from swing pivots and highlights the first valid breakout with clear, actionable visuals. Once a breakout occurs, the tool overlays ATR-based take-profit (TP) and stop-loss (SL) rails and tracks which level is reached first, helping traders evaluate follow-through after a structural break. Designed for clarity and speed, it works on any timeframe and instrument, and it offers flexible controls to switch between wick or body pivots and to enable/disable bullish or bearish structures.
2) How the Indicator Works
Pivot detection
- The script scans left/right bars defined by
periodto confirm swing highs and lows. pivottype = 1→ uses wicks (low/high).pivottype = 0→ uses bodies (min(open, close)/max(open, close)).
A pivot is confirmed when the current candidate is lower (for lows) or higher (for highs) than the surrounding window on both sides. This ensures robust swing points and limits noise.
Trendline construction
- Bearish lines are drawn by connecting two descending pivot highs (PH).
- Bullish lines are drawn by connecting two ascending pivot lows (PL).
- The slope is computed from the latest two relevant pivots and the line is projected forward bar by bar.
Breakout logic
- For bullish setups (using pivot highs): the indicator checks when price closes above the projected line → breakout.
- For bearish setups (using pivot lows): the indicator checks when price closes below the projected line → breakout.
On the breakout bar, the script establishes TP/SL levels and begins tracking which one is hit first.
Volatility engine (TP & SL)
- The buffer
Zbandis derived from ATR(30) and the instrument price, then shifted and halved as used in the code. - TP/SL are placed symmetrically around the breakout reference using a multiplier (
*20in the script). - As bars evolve, the script checks: TP hit first (win) or SL hit first (loss).
Drawing layer (what you see)
- Trendline segments to the breakout point.
- ▲ / ▼ breakout icons at the crossing.
- Dotted TP/SL rails that extend until the exit bar.
- ✖ marker at the exact exit price (TP or SL first).
3) Inputs & Defaults (Configuration Panel)
| Input | Type | Default | What it controls | Notes & typical ranges |
|---|---|---|---|---|
period |
Integer | 9 |
Swing width (pivot sensitivity) | 6–20 common. Lower = more signals, more noise. Higher = smoother, fewer but stronger lines. |
pivottype |
Integer | 1 |
1 = wicks; 0 = bodies | Bodies help reduce false breaks from wick spikes; wicks capture “true extremes”. |
showtrendUP |
Boolean | 1 |
Show bullish (breaks of descending highs) | Set to 0 to hide all bullish structures. |
showtrendDN |
Boolean | 1 |
Show bearish (breaks of ascending lows) | Set to 0 to hide all bearish structures. |
Under the hood:
leftbars = periodrightbars = max(1, floor(period/2))
This creates a forward/backward confirmation window around each candidate swing.
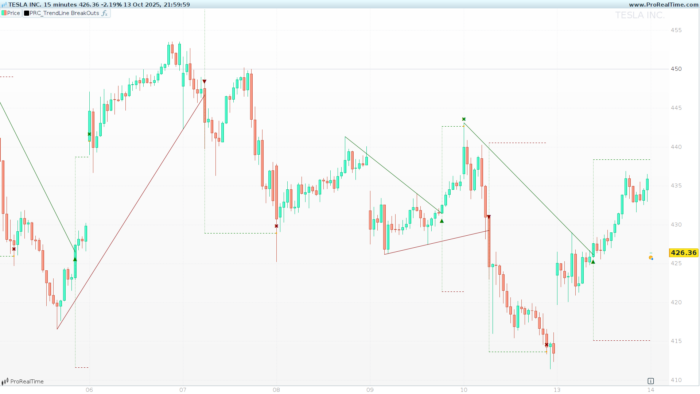
4) Signal Anatomy & Chart Markings
Bullish pattern (break above a descending line built from pivot highs):
- Dark green trendline up to the breakout bar.
- ▲ green marker at the breakout.
- Green dotted line for TP and dark red dotted line for SL.
- ✖ orange point at the exit (whichever is hit first), with a small green label.
Bearish pattern (break below an ascending line built from pivot lows):
- Dark red trendline up to the breakout bar.
- ▼ dark red marker at the breakout.
- Green dotted line for TP and dark red dotted line for SL.
- ✖ orange point at the exit, with a small dark red label.
Legend (quick view):
- Trendlines: dark green (bullish), dark red (bearish).
- Breakout icons: ▲ (up), ▼ (down).
- TP: dotted (green).
- SL: dotted (dark red).
- Exit: ✖ (orange point + label).
5) Trade Management Logic
- On breakout, the indicator computes TP and SL using the volatility buffer
Zband. - It simulates the path bar by bar after the breakout: if TP is touched first, it registers a win; if SL is touched first, a loss.
- The script draws until the first event occurs; if neither is hit by the current bar, the rails remain open to barindex.
islastbarupdateensures drawing is efficient and that only relevant, up-to-date segments are output on the last recalculation.
6) Code (ProBuilder)
Share this
No information on this site is investment advice or a solicitation to buy or sell any financial instrument. Past performance is not indicative of future results. Trading may expose you to risk of loss greater than your deposits and is only suitable for experienced investors who have sufficient financial means to bear such risk.
ProRealTime ITF files and other attachments :
Find other exclusive trading pro-tools on ![]()
PRC is also on YouTube, subscribe to our channel for exclusive content and tutorials


Great Indicator Ivan, thank you so much! It seems better than similar indicator that are available in the market 🙂
Hi Ivan, great work. I’d love to try this indicator in an automated system, but I don’t understand what I should do to trigger an entry signal with the red or green arrows.
Thanks
Hello. It would be very interesting to integrate this indicator into an automated trading system.