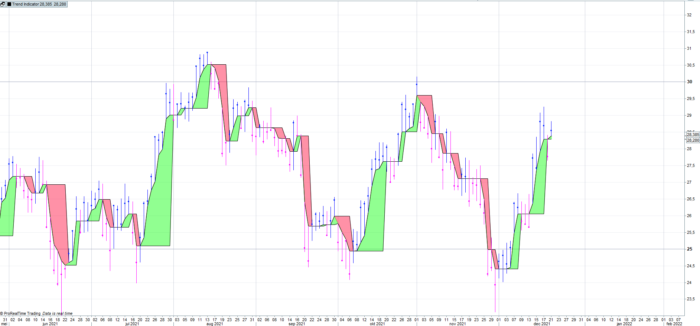
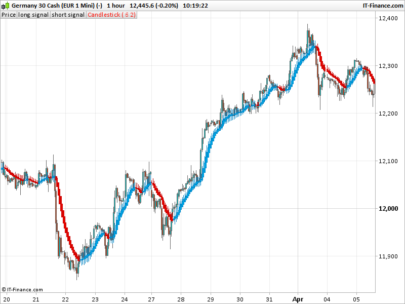
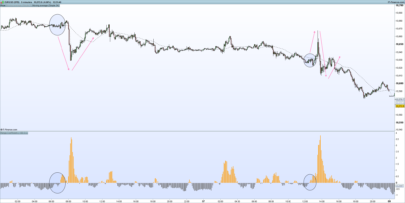
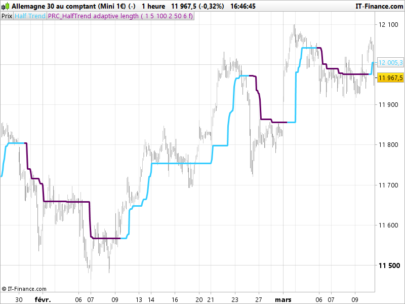
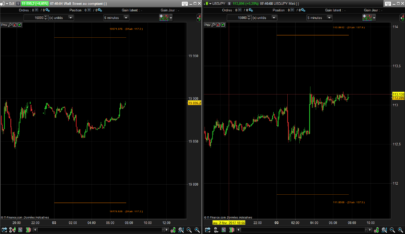
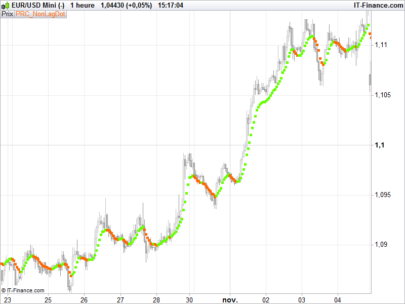
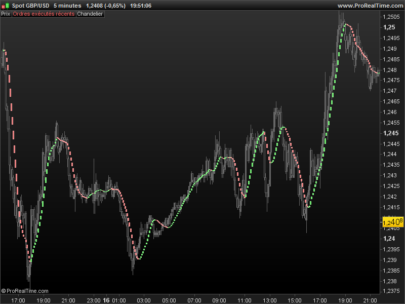
This indicator is based on the range of the price movements and the colored areas might help you to easy identify the trend of the price.
|
1 2 3 4 5 6 7 8 9 10 11 12 13 14 15 16 17 18 19 20 21 22 23 24 25 26 27 28 29 30 31 32 33 34 35 36 37 38 39 40 |
// This indicator is based on the range of price movements and the colored areas might help you // to easy identify thr trend of the price ONCE AFR = Close ONCE i = 0 ONCE j = 0 IF High < AFR THEN AFR = high ENDIF IF Low > AFR THEN AFR = low ENDIF IF Close > AFR THEN DRAWPOINT(barindex, close, 1)coloured(0,51,255) DRAWSEGMENT(barindex, high, barindex, low)coloured(0,0,255) ELSE DRAWPOINT(barindex, Close, 1)coloured(251,0,255) DRAWSEGMENT(barindex, high, barindex, low)coloured(255,0,255) ENDIF IF AFR < AFR[1] THEN i = i + 1 AFR2 = AFR[i] ELSE i = 0 AFR2 = AFR ENDIF IF AFR > AFR[1] THEN j = j + 1 AFR3 = AFR3[i] ELSE j = 0 AFR3 = AFR ENDIF RETURN AFR, AFR2, AFR3 |
Share this
No information on this site is investment advice or a solicitation to buy or sell any financial instrument. Past performance is not indicative of future results. Trading may expose you to risk of loss greater than your deposits and is only suitable for experienced investors who have sufficient financial means to bear such risk.
ProRealTime ITF files and other attachments :
Find other exclusive trading pro-tools on ![]()
PRC is also on YouTube, subscribe to our channel for exclusive content and tutorials

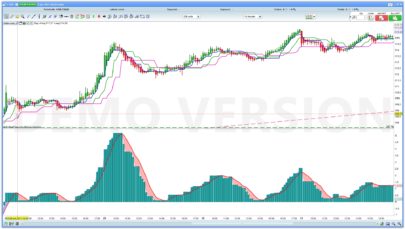


Hi Sever, how can I visualize the coloured areas?
Hi Stenozar,
You need to add the color zones yourself , just go to Add Color Zone
To set use for ,,,line 1 : range and for ,,,line 2 : range2 .
Add the second color zone:
Use for ,,,line 1 : range and for ,,, line 2 : range3.
In the first lines block you choose: Line 1 Line 2
Hope you get it!