Tested Levels Indicator

Tested Levels Indicator

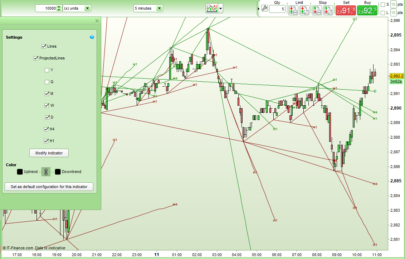
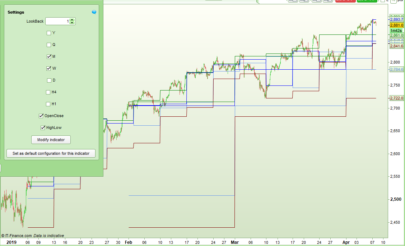
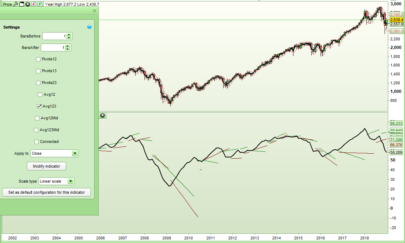
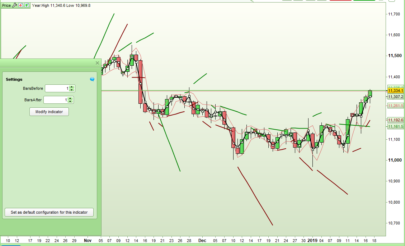
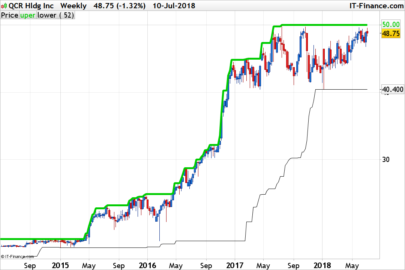
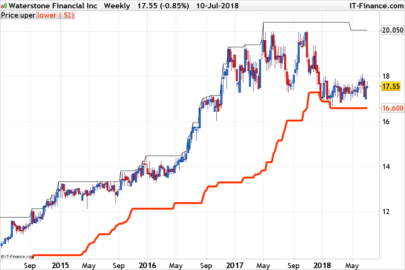
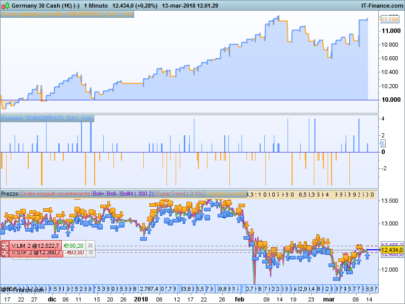
This indicator checks back over the last ‘p’ bars to see if the mid point of the current bars shadows have been tested by price and failed to breakout before.

Set ‘tests’ to the quantity of level tests you want to check for.

The indicator will draw a line from the first price test bar until a new set of price tests are detected. It draws green lines for upper shadow tests and red lines for lower shadow tests.

It can be slow to draw so I recommend setting the CALCULATEONLASTBARS to a sensible level.

I advise downloading and importing the ITF file to get full functionality.

Share this

Risk disclosure:

No information on this site is investment advice or a solicitation to buy or sell any financial instrument. Past performance is not indicative of future results. Trading may expose you to risk of loss greater than your deposits and is only suitable for experienced investors who have sufficient financial means to bear such risk.

ProRealTime ITF files and other attachments : How to import ITF files into ProRealTime platform?

PRC is also on YouTube, subscribe to our channel for exclusive content and tutorials

  1. Canis Majoris • 02/21/2020 #

    Hi ,

    Helpful indicator …

  2. Maxime Csls • 02/21/2020 #

    Bonjour Vonasi, Bravo pour ton travail ! Est-il possible de créer un screener quand le prix repasse à la hausser la ligne de Support rouge ?

  3. amitoverseas40 • 02/21/2020 #

    Hi Vonasi, I find this indicator very useful. May I request , if you can, to please modify and show close below the defined levels as a DOWN arrow and close above as an UP arrow , generate alert, and make this a screener as well? Regards!

    • Nicolas • 02/21/2020 #

      Please open a new topic in the ProScreener section, someone will code this request quickly.

  4. carpentier Joffrey • 02/21/2020 #

    Bonjour à tous,
    Avant tout merci pour ce travail, cependant je suis bloqué quand je l’installe sur prt.
    On me demande de régler le p et le test mais je n’arrive pas à trouver à quel endroit, je dois inscrire ces variables.
    Dans l’attente de vous lire,

    Merci à tous

  5. carpentier Joffrey • 02/21/2020 #

    Re,
    C’est ok, j’ai trouvé mon erreur…
    Cependant sur quel base peut on calculer son CALCULATEONLASTBARS à un niveau raisonnable ?
    Merci à vous,

  6. Aragorna • 02/21/2020 #

    Hi Nicolas, How is it possible to use it in a higher timeframe plotted on a lower timeframe? when I do this, lines are plotted completely offset on the left to the candles.

avatar
Register or

Likes

avatar avatar avatar avatar avatar avatar avatar avatar avatar avatar avatar avatar avatar avatar avatar avatar

+3 more likes

Related users ' posts
thierrybl Thanks a lot
B-ling1 Hi Vonasi, I love this indicator - good job! Just one question: If I want the monthly OHLC L...
ezman Copy and paste this code, don't work. error!
datageek How do I change the thickness of the line or change it too dashed lines? Kind regards
lkiklkik NE fonctionne pas ( ou plus ... )
Nicolas il faut modifier toutes les références à top par itop et bottom par ibottom. Ces mots étant ...
sir_i Bonjour à tous, Je suis nouveau sur le forum et sur la plateforme, pourriez-vous me dire com...
Nicolas Il faut simplement l'appliquer sur le prix.
sir_i Merci pour la réponse, je ne suis pas familier avec l'application de cette procédure simple,...
Vonasi There is another version of this indicator that can plot the same lines but onto an indicato...
Martin35 Hello Vonasi, do you think it is possible with PRT to code with the same principle as on thi...
abhay I am getting a shading between the lines, how can I avoid that. I just want to see lines as ...
Vonasi Delete the 'Color Zone' in the indicator settings window.
mathiasKN Steffen Schmauch • 12/11/2018 # hello Nicolas, can I change the indicator that I only get t...
Nicolas Please open a new topic in the indicator forum and explain there your query, thank you.
upupandaway This seems like a very useful indicator. However, it does not seem to open properly in the c...
mscharstrom Hi @robertogozzi, I really love this indicator. However, I'd like to tinker with it to fit ...
Ahimsa Hi Roberto I cannot thank you enough for writing this code. It could help me more than you ...
Nicolas With PRT v11, you have to click on "price" at the upper left side of the price chart.
Paul the last update can be found in topic Strategy DayOpen Straddle for DAX on page 14.
bertrandpinoy l instruction GRAPH pose problème sur PRT... pas vous? cordialement
Nicolas Supprimer simplement les lignes avec GRAPH pour passer en ProOrder, trading live.
Nicolas Sure, I suggest you open a new topic in the forum to discuss about your ideas.
hdgm Bonjour Nicolas, est ce que l'on peut en faire une stratégie de trading automatisée ?
Nicolas Non, pas en utilisant l'indicateur zigzag traditionnel de la plateforme.
fredfilm Hi Nicolas, how could we add a price screen to this? eg stock prices between $1 to $3 etc
Gianluca ok i fixed it i hope is ok like this: //TAC trader zone 10.2 | indicator //01.01.2018 //R...
TAC Bolsa Hello try this new version or view the blog with the new indicators .. https://www.t...
TAC Bolsa Sorry, TAC Trader Zone V2 https://www.tiburonesdealetacorta.com/2018/11/indicador-tac-tr...
Simba Greetings from germany! :) Can you told me your EXIT-strategy for this, please? :) Would ...
Spawn Voici une version améliorée qui tient compte de plus de critères, notamment l'intégration de...
Eric If you have a high percentage winners and the trades are closed with take profit the spread ...
Casenova I Agree with you JaunJ, and Yes Eric, what you say makes sense too. Optimizing the Stop Loss...
ET Thanks for the system Casenova. In determining the high of the past 4 bars, is there a reaso...
ak5hay2 Works like crazy on bitcoin. Use different timeframes. Thanks a lot Doc!!!
richyowen Hi, great code thanks. Very new to this forum. Is there a way to add a 100point target on an...
lisamitch50 Morning all, Just backtested on quite a few instruments, worked well on backtesting, but tel...
FULVIO09 Attualmente non c'è sufficiente volatilità : la condizione "C0 = AverageTrueRange[1500](Clos...
vlongobardo67 Ma io intendevo in backtest ! Scusa non l’ho menzionato.
ciniselloftse salve fulvio .il trading sistem e sempre profittevole?
reb Hello have you used this strat since last year ? live or Back test ? What are the results ?
beeb Yes last Year. But only back test
drysheep Hi all, did anyone test this strategy recently? As i dont get a single trade in the backt...
Nicolas
8 years ago
Nicolas Merci, faire une demande dans le forum approprié.
Pere Thanks for this good indicator Nicolas. I would like to make the upper and lower limits mor...
Nicolas because fractals are known 2 bars later! that's why I used rectangle to plot them in the past.

Top