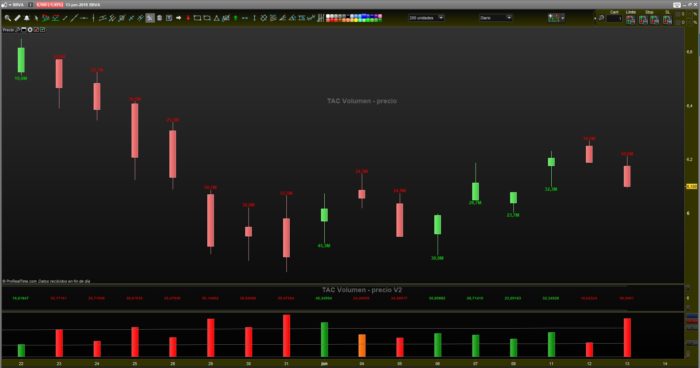
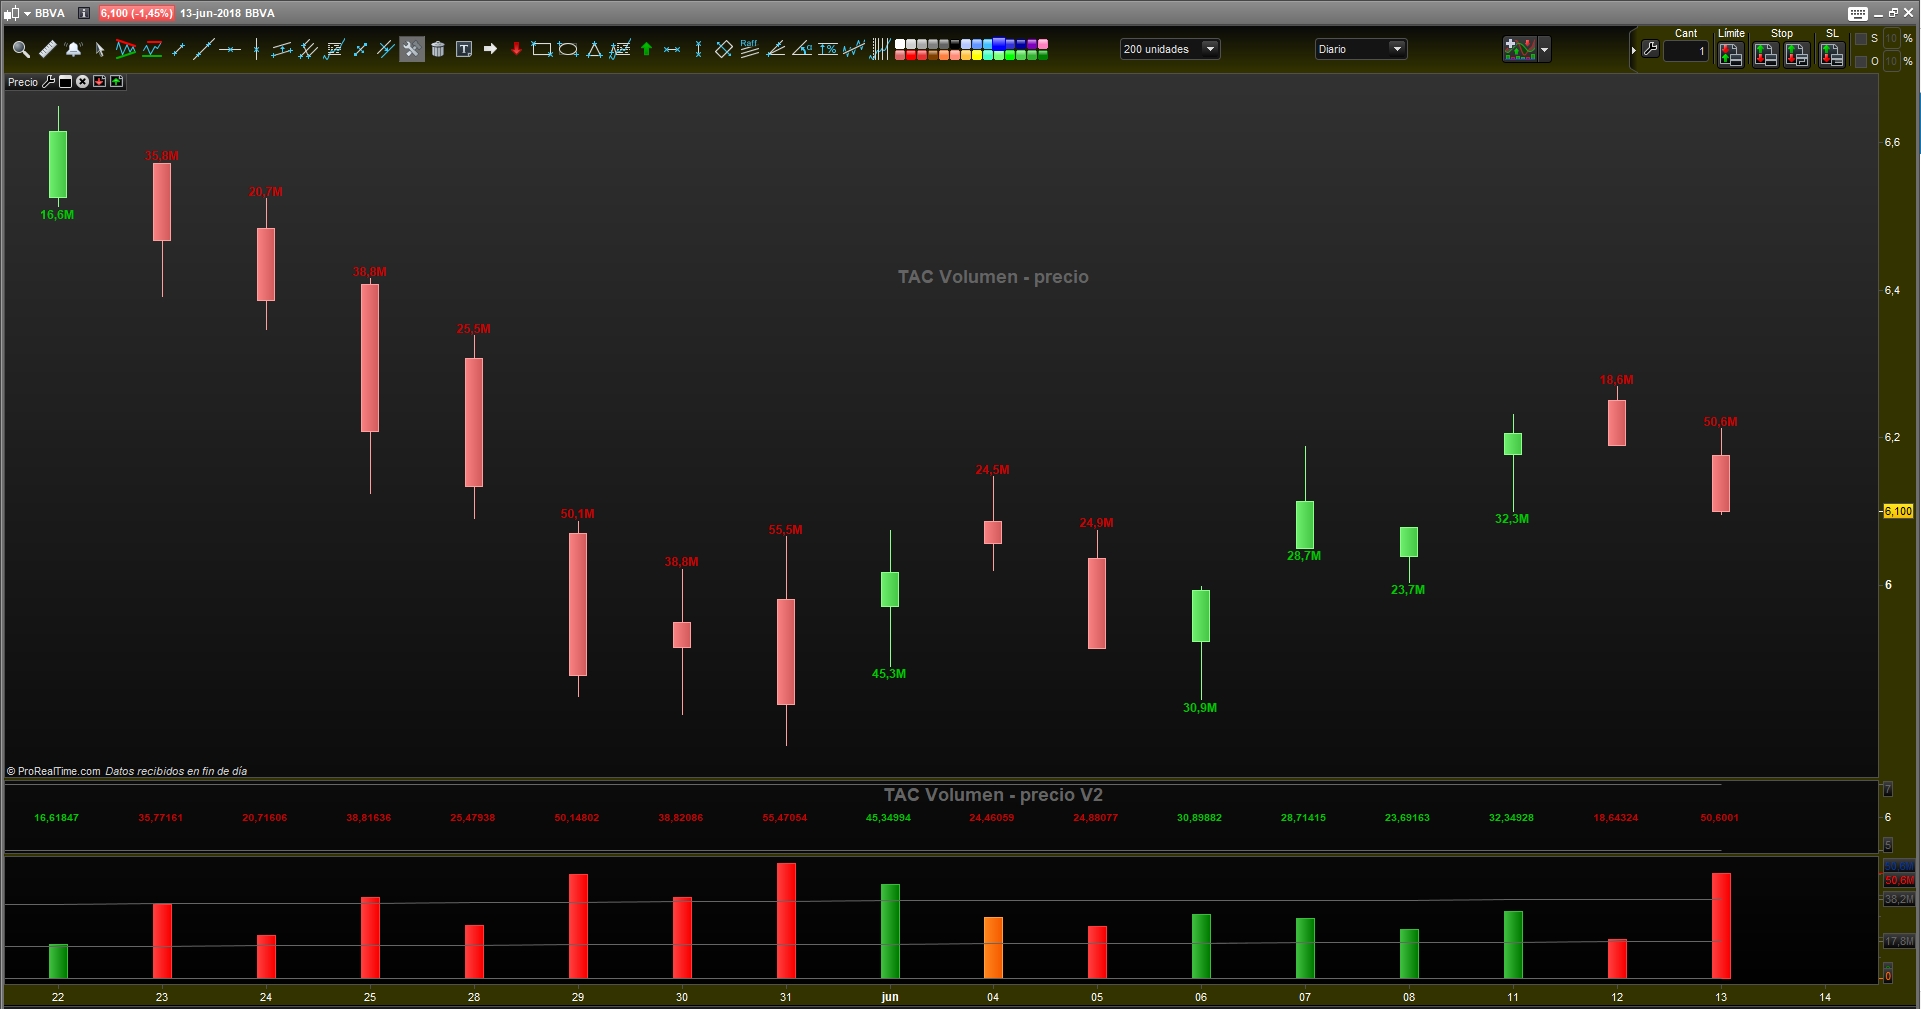
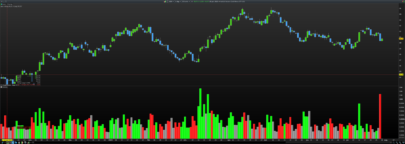
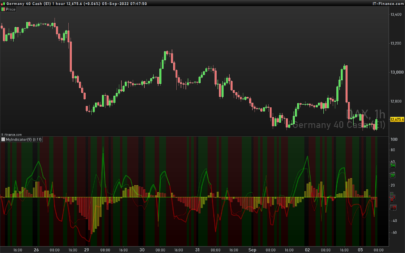
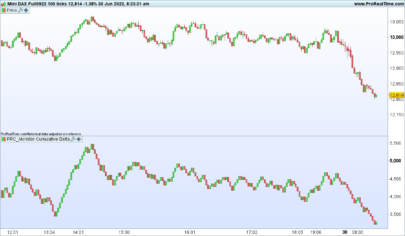
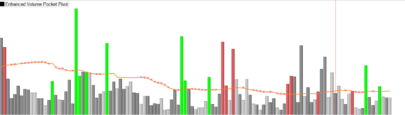
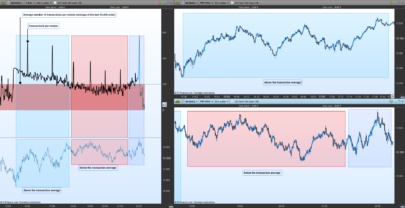
Two indicators that mark the negotiated volume per bar or candle.
- TAC Volume – precio: Total volume negotiated on the price.
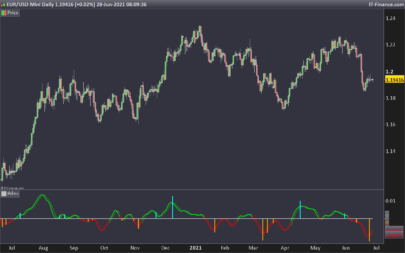
- TAC Volume – preciov2: decimal volume in the form of an indicator
TAC Volume – precio: Total volume negotiated on the price.
|
1 2 3 4 5 6 7 8 9 10 11 12 13 14 15 16 17 18 19 20 21 22 |
REM Bloque Volume REM TAC Volume - precio | indicator REM 08.12.2017 REM RB @ www.tiburonesdealetacorta.com REM Sharing www.tiburonesdealetacorta.com cuerpo = (close - open) vol=volume barraVerde = cuerpo > 0 barraroja = cuerpo < 0 PresionAlcista = barraVerde * Vol PresionBajista = barraRoja * Vol if PresionAlcista <> 0 then DRAWTEXT("#PresionAlcista#", barindex, low-0.01, Dialog, bold, 12) COLOURED(0,200,0) else DRAWTEXT("#Presionbajista#", barindex, high+0.01, Dialog, bold, 12) COLOURED(200,0,0) endif Return |
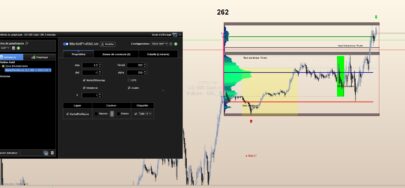
TAC Volume – preciov2: decimal volume in the form of an indicator
|
1 2 3 4 5 6 7 8 9 10 11 12 13 14 15 16 17 18 19 20 21 22 23 24 25 26 |
REM Bloque Volume REM TAC Volume precioV2 | indicator REM 08.12.2017 REM RB @ www.tiburonesdealetacorta.com REM Sharing www.tiburonesdealetacorta.com hi = 5 Mi = 7 cuerpo = (close - open) vol=volume barraVerde = cuerpo > 0 barraroja = cuerpo < 0 PresionAlcista = barraVerde * Vol / 1000000 PresionBajista = barraRoja * Vol / 1000000 if PresionAlcista <> 0 then DrawText("#PresionAlcista#",barindex,6,SansSerif,bold,10)coloured(0,200,0) else DrawText("#Presionbajista#",barindex,6,SansSerif,bold,10)coloured(200,0,0) endif Return hi coloured (102,102,102) as "Line HI" , mi coloured(102,102,102) as "Line low" |
Share this
No information on this site is investment advice or a solicitation to buy or sell any financial instrument. Past performance is not indicative of future results. Trading may expose you to risk of loss greater than your deposits and is only suitable for experienced investors who have sufficient financial means to bear such risk.
ProRealTime ITF files and other attachments :
Find other exclusive trading pro-tools on ![]()
PRC is also on YouTube, subscribe to our channel for exclusive content and tutorials


Hello TAC, thanks for these indicators! However a problem on the “Doji” indicator returns a value of 0, when Open = Close!
Hi,
Tell me what temporary and active framework ..
The indicators of volume can get a better reading in 1 hour graphics 4 hours, daily or higher.
All “UT” when Open = Close
send me a screenshot by mail. and I see it …
Ok
substitute this
barraVerde = cuerpo > 0
barraroja = cuerpo = 0
barraroja = cuerpo <= 0
Hi Tac, how do you use this indicator? is it useful to find divergence between volume and price, for example when we have a red candle and green bar of volume on a support area?
Hi,
In the next version I will incorporate the simulated Delta.
I recommend you use Delta.
You can download it in this Link where you have information of use.
https://www.tiburonesdealetacorta.com/search/label/TAC%20Volume%20Delta%20v3%20-%20Acumulative%20Delta
This indicator shows you the “no offer” or “No demand”.
It is based on Tom Williams’ VSA.
Bearish bars: if the price decreases with volume lower than the previous two bars, with range
narrow, and the price closing at half or higher, indicates “No offer”.
Bullish bars: weakness manifests in bullish bars, especially when the ranges are narrow, with
less volume than the two preceding bars. This is a sign of “No demand” from professional operators.
• Bullish volume is an increase in volume in price increases and decreasing volume in price decreases.
• Bearish volume is an increase of the volume in the decreases, and decreasing volume in the increases.
If we observe that the volume is decreasing in the successive bearish candles, this is evidence that the total selling pressure is decreasing. The market may continue to fall, but be careful because it can quickly turn around and rise temporarily, given the lack of supply. A decreasing volume amount in any bearish bar indicates that there is no professional interest in the bearish side.
In the new version: we will incorporate, principles of VSA of Ton Wiliams on supply and demand. As shown in the link.
https://2.bp.blogspot.com/-F0KERQMwfLA/WyOKBW3Rf_I/AAAAAAAAB2M/DjFakUv9kQY-Pomfg-DJFV–Dc5aD9syQCLcBGAs/s1600/capturada1.jpg
El problema es que no hay datos de volumen real de ninguna manera entonces si que en una suministradora determinada pueden ser datos reales durante un periodo de 12 hora entre sincronizaciones sin embargo los datos de volumen reales no existesn es imposible ni siquiera a disposicion de los pros por tanto todo y los grandes estudios sobre volumen que hay en el mercado ni uno solo es valido en el momento mas inoportuno te hunden la cuenta
Cómo que no existen datos de volumen en real… Es que te basas…..
Tanto para el Forex desde 2004 como para los indices Usa desde 2010 como para todos los principales indices desde 2014 ya no existe un mercado unico existen hasta 20 suministradoras de datos diferentes que cada dia sincronizan datos a las 23 h y a las 8 h CET por tanto es imposible saber o comocer los datos de volumen ya que nadie iene los datos de las 20 suministradoras yo dispongo de datos de dos de las 4 mas grandes y aun asi y pagar por la informacion de volumen solo tengo un 37% del mercado real por tanto todo lo demas es falso y ficticio si que es verdad y esto suele llevar a engaño que los Inversores muy muy grandes suelen operar con al menos 15 de las suministradoras sencillamente para disponer de mas clientes para operar como contrapartida y esto suele llevar a que en depende que momentos el volumen lo mires con una u otra suministradora es parecido sin embargo te aseguro que yo que tengo un equipo grande con bastantes pantallas hay momentos en que el mismo indice FTSE Dax Dow SP o el que quieras durante periodos de mas de 10 minutos tienen diferenciales de hasta 20 o 30 puntos y despues poco a poco se vuelven a igualar por tanto este volumen que provoca estos cambios es incontrolable desde ninguna suministradora muchisimo menos desde un broker (parece una broma ) y la verdad es que es una pena porque ya desde wyckoff el estudio del volumen dispone de una cantidad de herramientas y teorias muy muy buenas solo que si partimos de la premisa que los datos son muy incorrectos todo lo demas ya no importa Para mas informacion forex ya no hay ninguna duda y con los indices los Usa hace años que mueven mucho mas dinero fuera de sus horaios de paket que dentro (por este motivo las empresas USA multiplicaron su capitalizacion bursatil por mucho desde 2010) y europa siguiendo a la city como siempre perdio el tren hasta que los del Dow sacaron el eurostock50 y a partir de ahi todos a correr sin embargo ahora desde hace ya dos años el dax tambien mueve mas dinero fuera de horario de parket que dentro por tanto los volumenes de parket completamente falseados tambien pue eso es el mercado que operamos
Estas equivocado al 99,9%.
La correlación entre las series de precios y volúmenes las desconoces.
Tanto los índices como las acciones el dato del Volumen es público de cada sesión.
En el caso del Ibex y sus activos el dato del volumen los puedes obtener de aquí.
http://www.bolsamadrid.es/esp/aspx/Mercados/Precios.aspx?indice=ESI100000000
Este es el mismo Volumen que está en Prorealtime como Ejemplo:
-Banco Santander sesión del dia 20/0/2018 Volumen 53.144.920.
-Volumen en BME = 53.144.920
-Volumen en Prorealtime = 53.144.920
Si tu Broker no te marca este dato, cambia de Broker.
Para Forex en Prorealtime no existe Dato de volumen.
Para otras plataformas tienes que tener datos CQG que replican de su activo Futuro al Tick o Milisegundo.
Si tu Broker o la plataforma que usas no te permite ver el dato del Volumen que es publico Cambia de Broker.
Esto es muy largo de explicar… en un foro.
Si hablas de un indice regional como el Ibex es posible que sea asi yo nunca lo he operado y mira que llevo años en cuanto a lo demas creo que hablas de hace muchos años no voy a entrar aqui en largas explicaciones como bien dices sin embargo creo que el equivocado y mucho sigues siendo tu venga suerte y que tengas muy buena operativa que al fin y al cabo de esto se trata solo comentarte que no utilizo datos de ningun broker los compro directamente a una de las suministradoras bueno ahora a dos pero esto es otra historia
Regional de Mostoles, en una cosa tienes razón mejor dejarlo aquí…