
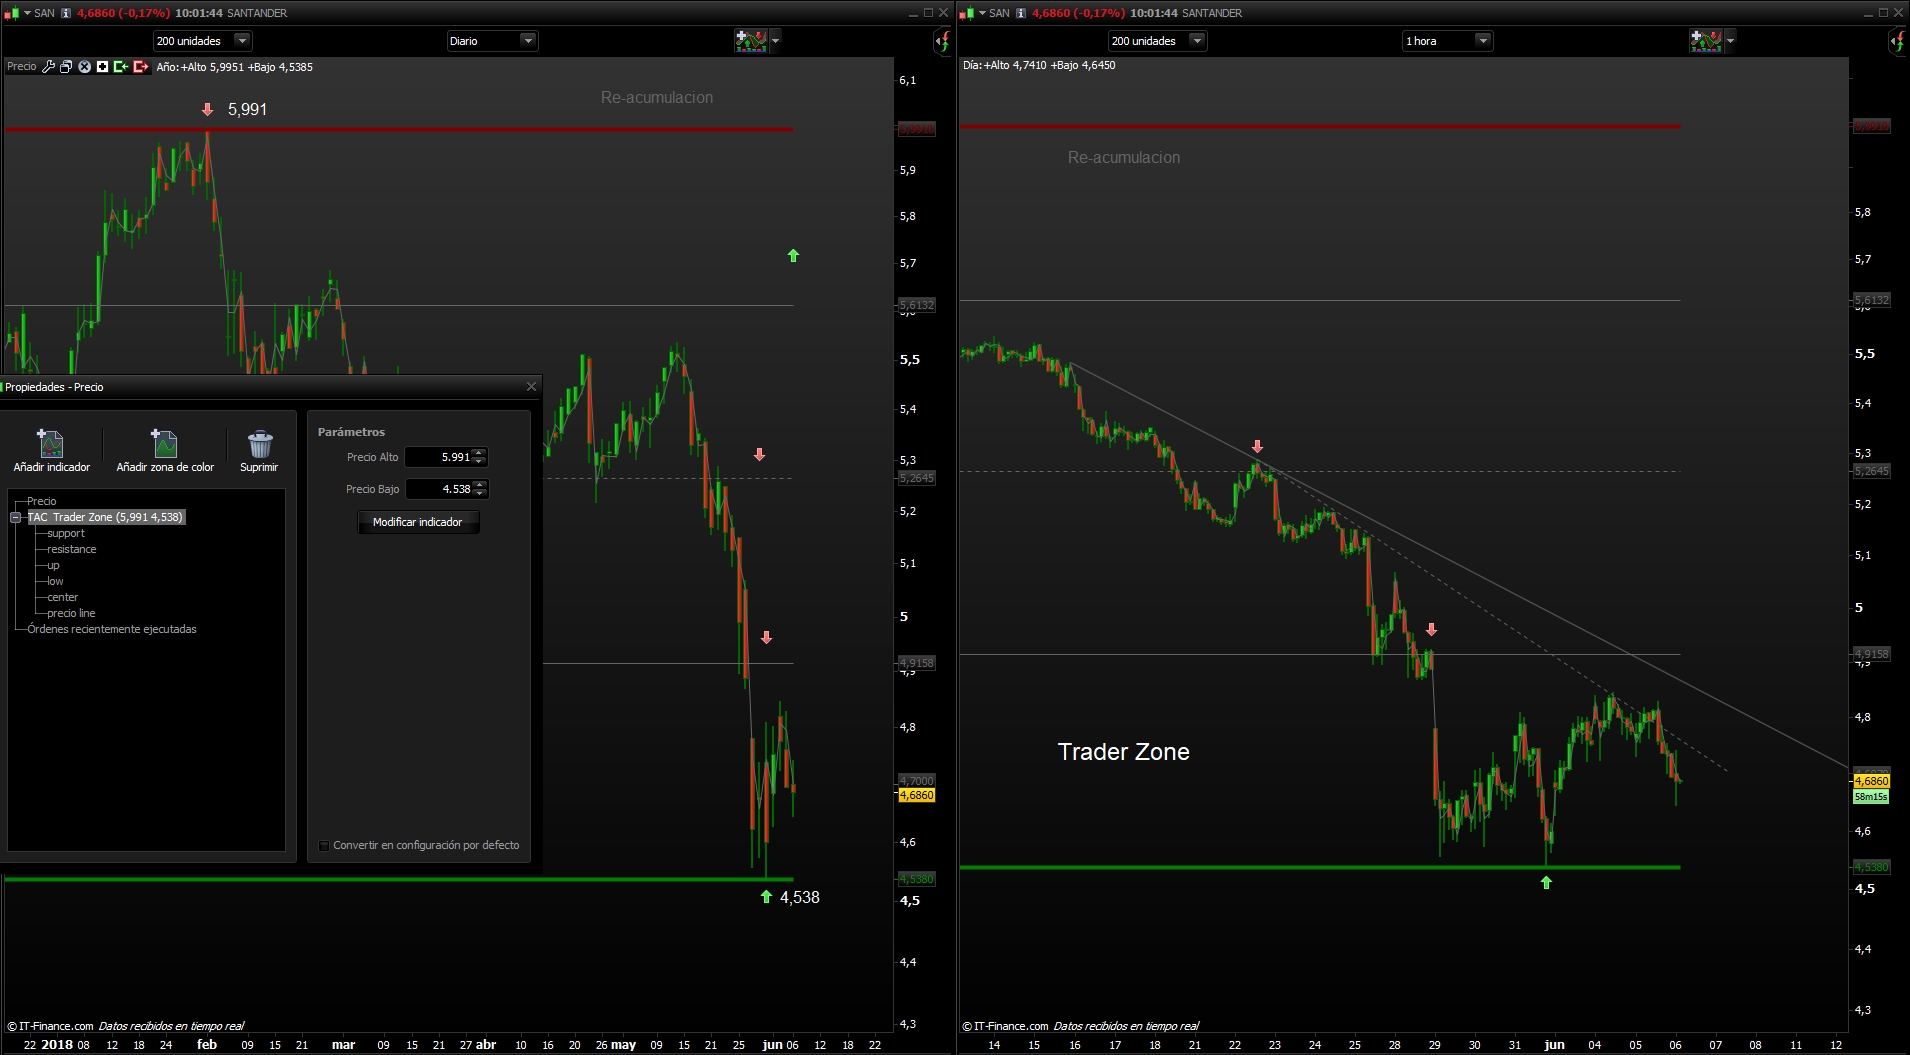
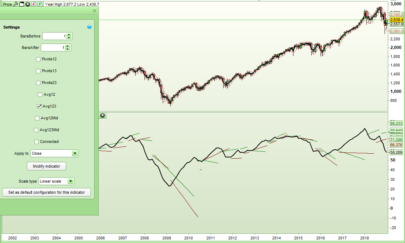
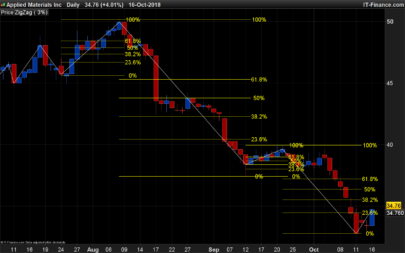
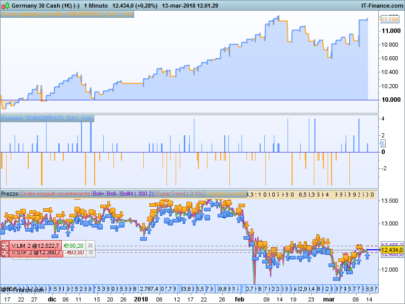
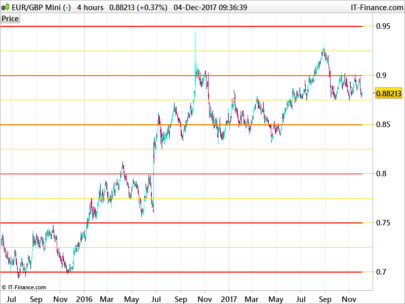
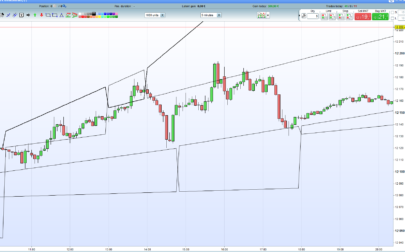
Supports and resistances based on the proportion of the wave.
They are drawn from the daily chart maximum and minimum to obtain the proportionality of the market.
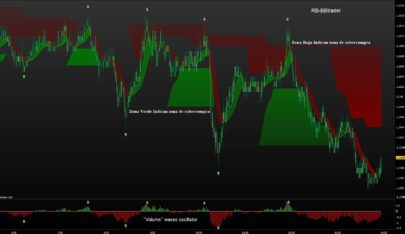
The result is a Trader zone in lower graphics.
|
1 2 3 4 5 6 7 8 9 10 11 12 13 14 15 16 17 18 19 20 21 22 23 |
////////////////////////////////////////////////////////// //TAC Trader Zone | indicator //06.06.2018 //RB @ www.tiburonesdealetacorta.com //Sharing ProRealTime ///////////////////////////////////////////////////////////// //pa = 5,991 //pb = 4,538 HI=high-close lo=low+open mm = (hi + lo) / 2 mem = (pa + pb) /2 delta = pa - pb cla = delta * 0.26 cla1 = delta * 1 cla2 = delta * 1 a = pa - cla b = pb + cla c = pa - cla1 d = pb + cla2 return c coloured (0,128,0) as "support", d coloured (128,0,0) as "resistance", a coloured (102,102,102) as "up", b coloured (102,102,102) as "low",mem coloured (102,102,102) as "center",mm coloured (102,102,102) as "precio line" |
Share this
No information on this site is investment advice or a solicitation to buy or sell any financial instrument. Past performance is not indicative of future results. Trading may expose you to risk of loss greater than your deposits and is only suitable for experienced investors who have sufficient financial means to bear such risk.
ProRealTime ITF files and other attachments :
Find other exclusive trading pro-tools on ![]()
PRC is also on YouTube, subscribe to our channel for exclusive content and tutorials


Interpretation: https://www.tiburonesdealetacorta.com/2018/06/tac-trader-zone.html
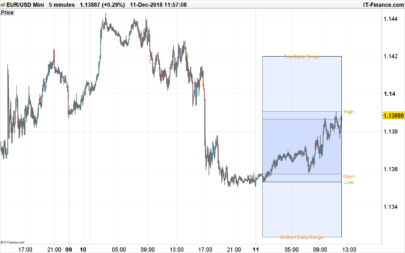
What are the arrows on the screen chart ? Are they linked to this indicator ?
No, it’s just an arrow of what the price on the line does.
Please access the Documentation to see how the indicator works
No, it’s just an arrow of what the price on the line does.
https://www.tiburonesdealetacorta.com/2018/06/tac-trader-zone.html
HE INSTALADO ESTE INDICADOR EN LA PLATAFORMA Y NO ME SALE IGUAL EN TODOS LOS GRÁFICOS. EN EL GRÁFICO DE BANCO SANTANDER ME SALE TAL COMO LO PONES TU. AHORA BIEN, CARGO EL GRAFICO DE TELEFONICA Y ME SALEN POR DEBAJO DEBAJO DEL PRECIO ACTUAL. ES NORMAL? TWITTER: ÀNGEL PUJALT SALUDOS.
Hola Angel
Dentro del indicador en la Raiz > parámetros:
Grafico 1 Hora
Precio Alto: 8.474
Precio Bajo:7.512
Aquí tienes que poner el máximo y el Mínimo que quieres tradear..
Aquí te lo explico https://www.tiburonesdealetacorta.com/2018/06/tac-trader-zone.html
a mi me interesa trabajar en periodos diarios y semanales. Hay alguna manera para canviar el código para que se vea en otros periodos temporales?
Lo puedes ajustar tu.. desde parámetros en el propio indicador.. Si tienes alguna duda escribe por TWITTER. Tienes la cuenta Bloqueada.
no la tengo bloqueada, sino que la tengo con candado. Pues no me aclaro con tu indicador.
Improvement in the calculation, for people who do not know Wyckoff structures .. Accumulation Distribution 10.2
//TAC trader zone 10.2 | indicator
//01.01.2018
//RB @ http://www.tiburonesdealetacorta.com
//Sharing ProRealTime
/////////////////////////////////////////////////////////////
Pa = 5.532
Pb =4.538
resta = pa – pb
centro = (pa + pb) / 2
rj1 = resta * 0.15
rj2 = resta * 0.34
gr1 = pa + rj1
gr2 = pb + rj1
gr3 = pb – rj1
gr4 = pa – rj1
gr5 = pa + rj2
gr6 = pa – rj2
gr7 = pb + rj2
gr8 = pb – rj2
return pb coloured (0,128,0) as “Precio bajo”, pa coloured (128,0,102) as “Precio Alto”, centro coloured (102,102,102) as “centro”, gr1 coloured (102,102,102) as “gr1”,gr2 coloured (102,102,102) as “gr2” ,gr3 coloured (102,102,102) as “gr3”, gr4 coloured (102,102,102) as “gr4”,gr5 coloured (102,102,102) as “gr5”,gr6 coloured (102,102,102) as “gr6”,gr7 coloured (102,102,102) as “gr7”,gr8 coloured (102,102,102) as “gr8”
Improvement in the calculation, for people who do not know Wyckoff structures .. Accumulation Distribution 10.3
Pa = 13550
Pb =8720
resta = pa – pb
centro = (pa + pb) / 2
rj1 = resta * 0.15
rj2 = resta * 0.34
gr1 = pa + rj1
gr2 = pb + rj1
gr3 = pb – rj1
gr4 = pa – rj1
gr5 = pa + rj2
gr6 = pa – rj2
gr7 = pb + rj2
gr8 = pb – rj2
return pb coloured (0,128,0) style(line,3) as “Precio bajo”, pa coloured (128,0,102) style(line,3) as “Precio Alto”, centro style(dottedline,1)as “centro”, gr1 coloured (102,102,102) as “gr1”,gr2 coloured (102,102,102) as “gr2” ,gr3 coloured (102,102,102) as “gr3”, gr4 coloured (102,102,102) as “gr4”,gr5 coloured (102,102,102) as “gr5”,gr6 coloured (102,102,102) as “gr6”,gr7 coloured (102,102,102) as “gr7”,gr8 coloured (102,102,102) as “gr8”
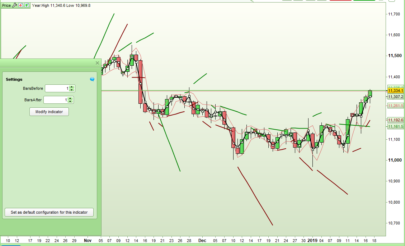
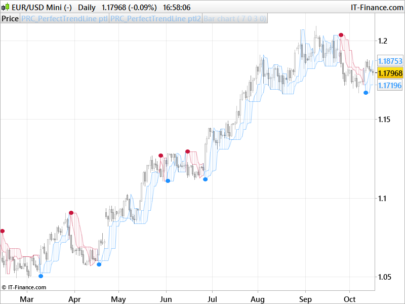
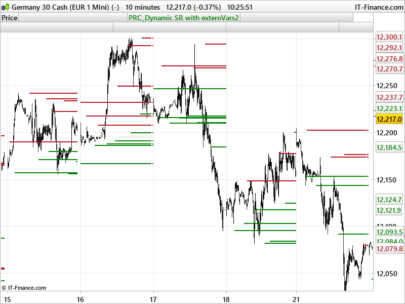
Horizontal line proportional to the price
Thank TAC Bolsa
Please for DAX
PA = ??
PB = ??
Grafico 1Hora, Ultima zona reconocida.
PA =12817
PB =12570
https://4.bp.blogspot.com/-ierFI1dri-I/Wxt_e8hc8nI/AAAAAAAAB1U/68N6YTBN1J0HrS_tZGZFWWjqGm548H69gCLcBGAs/s1600/fdax2.jpg
Horizontal line proportional to the price
https://4.bp.blogspot.com/-ierFI1dri-I/Wxt_e8hc8nI/AAAAAAAAB1U/68N6YTBN1J0HrS_tZGZFWWjqGm548H69gCLcBGAs/s1600/fdax2.jpg
Sorry, Horizontal line proportional to the price
https://3.bp.blogspot.com/-kueYAkR85HM/Wx374XscyiI/AAAAAAAAB1o/HZTdWsMV0kItAF0yfg-bqYF5R_q4XMP0gCLcBGAs/s1600/daxxf.jpg
Thank TAC Bolsa
Why 12817 and 12570 ?
Wyckoff method,
https://4.bp.blogspot.com/-ierFI1dri-I/Wxt_e8hc8nI/AAAAAAAAB1U/68N6YTBN1J0HrS_tZGZFWWjqGm548H69gCLcBGAs/s1600/fdax2.jpg
PA = AR
PB = SC
You can use it in support mode if you do not know Wyckoff.
First bullish movement = PB
First movement Bearish = PA
https://3.bp.blogspot.com/-Mw7qCxeehXc/Wx4Xc6q4moI/AAAAAAAAB10/mcn85G_LwhQGz8rmVDRvcOy8hRZq3PzXACLcBGAs/s1600/Soportes.jpg
This is a recommended indicator for structures of the Wyckoff method.
Scheme of accumulation: Wyckoff phases and volume
https://2.bp.blogspot.com/-8krsfYWRhhI/Wn6NswNVxNI/AAAAAAAABWs/hs6DTxuamT8ku7vYJM7FjAq_TuWKOfC6wCLcBGAs/s1600/Diapositiva1.PNG
Scheme of Distribution: Wyckoff phases and volume
https://1.bp.blogspot.com/-Wxlpu86ocBQ/Wn_zAeC0leI/AAAAAAAABW8/tmNokAh6cS0u1vuEjqxWDEyj-pnKij0dQCLcBGAs/s1600/Diapositiva1.JPG
Thank TAC Bolsa,
Excellent indicator, very good.
But I do not understand when to change AR and SC.
is there an indicator to find AR and SC?
There is no indicator.
Wyckoff Events
http://stockcharts.com/school/doku.php?id=chart_school:market_analysis:the_wyckoff_method
Thank you very much for yoyr usefull indicators i downloaded all of hit 🙂 but this one seems is not working, it show only the price live
ok i fixed it i hope is ok like this:
//TAC trader zone 10.2 | indicator
//01.01.2018
//RB @ http://www.tiburonesdealetacorta.com
//Sharing ProRealTime
/////////////////////////////////////////////////////////////
Pa = dhigh(0)
Pb = dlow(0)
resta = pa – pb
centro = (pa + pb) / 2
rj1 = resta * 0.15
rj2 = resta * 0.34
gr1 = pa + rj1
gr2 = pb + rj1
gr3 = pb – rj1
gr4 = pa – rj1
gr5 = pa + rj2
gr6 = pa – rj2
gr7 = pb + rj2
gr8 = pb – rj2
return pb coloured (0,128,0) as “Precio bajo”, pa coloured (128,0,102) as “Precio Alto”, centro coloured (102,102,102) as “centro”, gr1 coloured (102,102,102) as “gr1”,gr2 coloured (102,102,102) as “gr2” ,gr3 coloured (102,102,102) as “gr3”, gr4 coloured (102,102,102) as “gr4”,gr5 coloured (102,102,102) as “gr5”,gr6 coloured (102,102,102) as “gr6”,gr7 coloured (102,102,102) as “gr7”,gr8 coloured (102,102,102) as “gr8”
Hello
try this new version or view the blog with the new indicators ..
https://www.tiburonesdealetacorta.com/search/label/Indicador%20Trader%20Zone%20ARRZZ
regards
Sorry,
TAC Trader Zone V2
https://www.tiburonesdealetacorta.com/2018/11/indicador-tac-trader-zone-v2.html